Sync is a hard distributed systems problem and re-writing the heart of our sync engine on the desktop client was a monumental effort. We’ve previously discussed our efforts to heavily test durability at different layers of the system. Today, we are going to talk about how we ensured the performance of our new sync engine.
In particular, we describe a performance regression testing framework we call Apogee. Apogee helps us find unanticipated performance issues in the development process and safeguard against bugs that we would otherwise release to our users. As we developed our new sync engine, we used Apogee to compare the performance of new vs. old, ensuring that the Dropbox sync experience didn’t suffer when we rolled Nucleus out to our users. When we specifically sought to improve sync performance, we used Apogee as pre-release validation that our improvements had the intended impact. In this post, we’ll be covering Apogee’s system design, how we overcame challenges we faced while building it, and finish by discussing a few performance regressions it caught for us over the past two years.
Design
Apogee measures performance metrics (latency, cpu usage, disk i/o, memory usage, and network i/o) while running our existing end-to-end integration tests. In tests, this looks like a context manager that can be placed above a span of sync operations. The profile data can be annotated with key-value pairs that allow us to slice results based on the activity being profiled.
def performance_test(...):
  # Internally, this uses a timer for latency calculation and DTrace for counting
  # the performance metrics such as disk i/o, network i/o, syscalls etc.
  with apogee_profile():
    do_something()
    # `annotate` allows for adding attributions to the profile report generated
    # by `apogee_profile`. For example: annotate("num_files": 10000)
    annotate("key", "value")
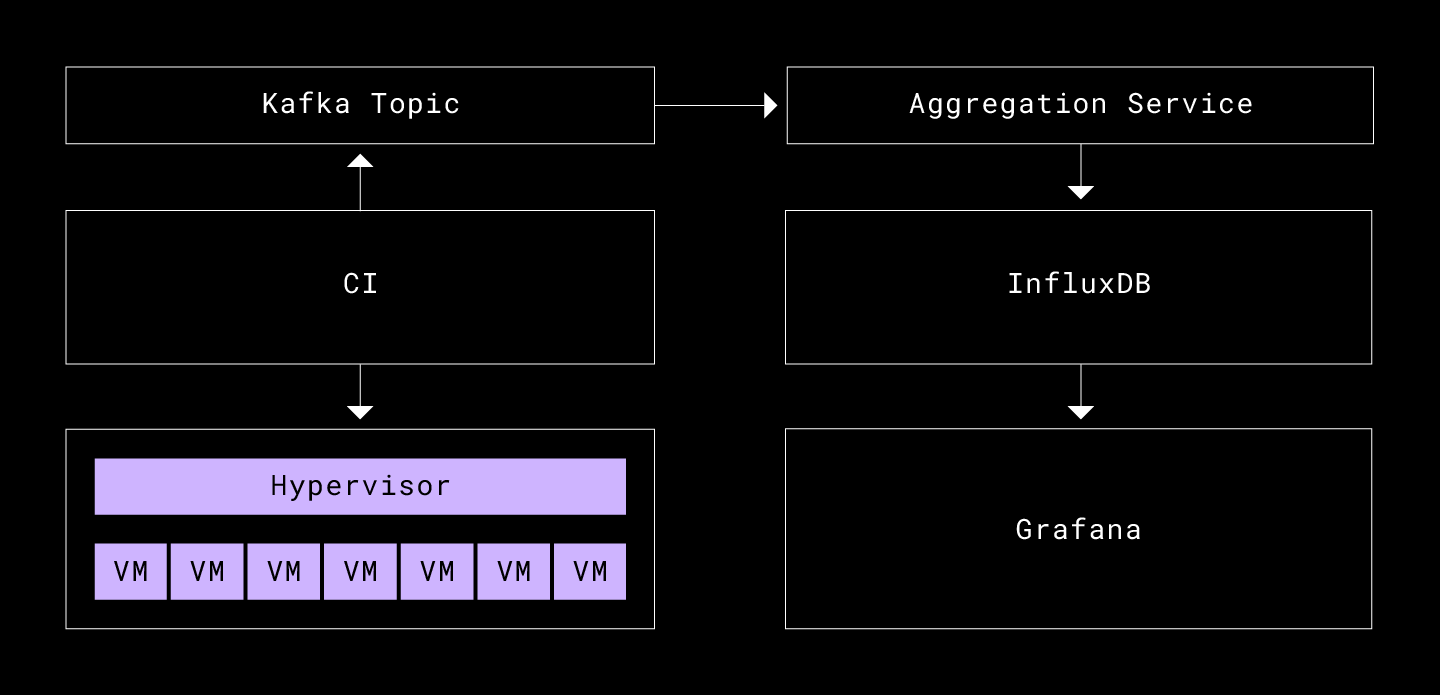
Our CI infrastructure automatically triggers these performance integration tests for every new commit, or periodically for some of the more expensive tests. Apogee aggregates and graphs the results. The data pipeline is as follows:
CI
The CI system at Dropbox allows for running custom test suites on all new commits. It produces the results of the builds to a Kafka topic, which we tail to retrieve the build artifacts, which include our profile data and test logs. The CI runs the integration tests across a pool of virtual machines that are managed by a hypervisor, which schedules these VMs with limited and shared critical resources such as memory, CPU, and network.
Aggregation service
This is a simple service, a Kafka consumer, that tails the relevant topic, aggregates the measurements from the build artifacts, and adds custom fields not available at test time such as link to the build, commit hash, author, link to logs etc. Once all the information around a build is aggregated, it writes the result to our time series database.
InfluxDB and Grafana
We use InfluxDB for our time series data persistence, as we are familiar with it. The interface is compatible with the shape of our metrics, and it has a well-tested plugin for the data visualization tool we use at Dropbox, Grafana. The InfluxDB protocol allows you to write alphanumeric fields (eg. latency, disk writes, commit hash, etc.) for a unique set of tag key-value pairs added in the tests with annotate(), (eg. {"operation": "upload", "num_files": "1000, "size": "1024"}) and timestamp (in our case, this was timestamp of the build).
Reducing variability
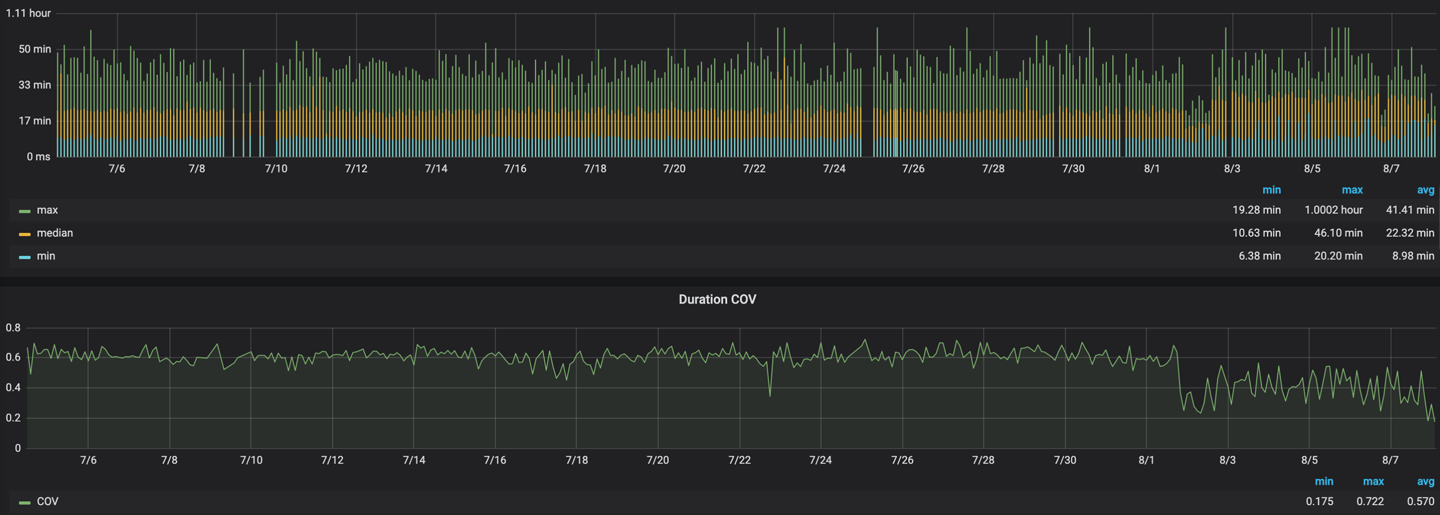
The key challenge in developing Apogee was defeating measurement variability. Before Apogee could reliably detect performance regressions between two different commits, we needed to prove that it could get consistent results when run multiple times on the same code. After building out the system described above, it was obvious that there was too much noise in our measurements to detect even large performance regressions, as measurement noise obscured any effects caused by code changes. If Apogee was going to be at all useful, we would need to invest heavily in driving down measurement variability when running repeatedly on the same code.
Challenges
Many factors in our problem space made driving down performance measurement variability challenging.
Test environment and platform
Dropbox runs across different platforms (MacOS, Windows, Linux) and so do our tests. Some of the areas of variability here were:
- Different tracing libraries and abilities (e.g. DTrace wasn’t available on Win when we built this but it now is :)
- Our CI system’s Mac VMs ran on racked MacPros, but Windows and Linux VMs ran on Dell blades
Real-world fidelity vs artificial repeatability
We constantly found ourselves navigating a fundamental tension between wanting to provide useful simulation of real-user environments while simultaneously reducing noise and variability.
Some of the challenges are as follows:
- Managing the explosion of variables
- Network disk vs. spinning disk vs. flash disk vs. RAMDisk
- Different network speeds, noise, and packet corruption rate
- Processor speed, cache size, memory, and interrupts/de-scheduling
- Using virtual machines vs. bare metal hardware
- Usually companies use dedicated performance labs with bare metal hardware
- Running against production server vs. dev server
Principles
Some of the principles we kept in mind when thinking about these challenges and the tradeoffs that came with them were:
- Don’t aim on becoming the panacea
Focus on the problem that matters the most in order to reduce the complexity that comes with solving all problems that the system could potentially solve
- Repeatability is key
Strive to keep the simulations as close to reality as possible but prefer artificial repeatability over real world fidelity if we have to pick one
- Make incremental progress
Given this multivariate space, first hold as many variables as possible constant, and only when we have confidence in the fidelity of these try varying more
Methodology
To help point us in the right direction early on, we ran the same sync tests over and over while profiling the client. We then merged all of these profiles and identified areas of code that had the highest variabilities in wall time, network i/o, disk i/o, and memory usage. We took duration as the first metric that we wanted to reduce the variability for. To understand where the variability was coming from, we used the coefficient of variation of other metrics (network i/o, disk i/o, and memory usage) to correlate it with that of the duration using the t-test. We tackled each of the highly-correlated and high-variability areas in order from most to least variable by reading the profiles and code, developing hypotheses, and running experiments to see the effect of various interventions on variability. Among the various strategies we employed, let’s walk through some of the ones that worked.
Application layer variance
Static sharding of tests
To be able to effectively run hundreds of thousands of tests, our CI generally uses dynamic sharding to efficiently distribute the load across the machines tests are run on. Pinning a subset of tests together for each run helped reduce the variability across runs.
Dropbox headless mode
Our main focus was on measuring sync performance, namely the work that happens between adding or editing files and when they’re fully synced. Our early measurements quickly identified that a large source of performance variability happened in the desktop client user interface. Things like rendering notifications and waiting for web views to load turned out to take a surprisingly unpredictable amount of time. It is also important to note that the system we were trying to test, the sync engine, did not depend on any of these components. Turning off the Dropbox desktop UI entirely and running in headless mode was one one of the biggest variability wins we got.
Non-determinism
While the sync engine proper now has deterministic execution, there were still certain areas of non-determinism, mainly in the form of server side rate limiting, backoffs, and timeouts. Running the tests against the stage variant of the our server reduced the chance of hitting these non-deterministic cases as it was usually under lesser load. We evaluated running it against another VM that ran all the essential backend services, but it meant that we lost some coverage on our network path. The variance from the non-determinism coming from the real server was low enough that we decided to go ahead with that.
Infrastructural variance
Homogenous VMs
Originally the hypervisor was tuned to share resources between child VMs to optimize for overall throughput. This meant it could provide unbalanced resources to VMs and de-schedule them as necessary. We tuned the hypervisor to make the control flow deterministic by fiddling with a few knobs, as follows:
- Processor affinity and memory reservation: Gave each VM its own dedicated resources so there is less contention in the pool. This helps with CPU cache performance and better simulates running on bare metal.
- High latency sensitivity: Adjusted to optimize scheduling delay to better serve low latency needs of the application.
- Disable clock sync: Disallowed the VM to spend time synchronizing clocks with hosts. If the VM spends time de-scheduled, then that would not be counted towards test timing.
RAM disks
Our CI system’s infrastructure used remote racks of flash-based drives to host client VMs, so all disk writes were actually sent out over the network. This meant that any disk i/o was potentially extremely variable. Our server storage infrastructure allowed us to bound the network resources used by any one VM so they couldn’t interfere with each-other, but this didn’t give us the reduction we wanted.
Because this was already such an unusual i/o situation (most of our users don’t host their Dropbox instances on VM-tuned network attached storage), we decided that swapping it out for another artificial yet more predictable storage solution would be preferable. We moved to using RAM disks. By mounting a portion of physical memory as if it were a hard drive and preventing that memory segment from being paged out, we were able to keep disk reads and writes made by our sync engine on the VM host—no more round trip across the data center.
This turned out to be a huge variability win, and also made Dropbox sync faster, but this was concerning, because we’d now made ourselves blind to an important class of potential performance issues. For example, f-syncing was now near instantaneous, so quadrupling the number of f-syncs wouldn’t affect our measurements, even though it would almost certainly impact customer experience. We’d be similarly ignorant of pathological access patterns that would tank performance on spinning disks or poorly utilize disk cache. However, we decided that this was a tradeoff worth making. We were also saved by tracking disk i/o and sync latency separately. Depending on the problem, we’d be able to observe a regression in disk performance even if we didn’t see sync taking longer.
Terminating background processes
Once we ran out of large sources of variability within Dropbox itself, we turned our attention to the broader environment in which it was running, and in particular other processes with which Dropbox was contending for resources. When we instrumented all processes running in the VM during our tests, we noticed that Dropbox scheduler preemptions and disk cache misses were highly correlated with a small subset of other processes running simultaneously. We got a modest variability win by terminating these troublesome processes before starting our tests.
For example, we noticed a common pattern on MacOS where Spotlight would race with Dropbox to index files newly added by our test logic. When the two were out of phase, it ruined disk cache performance, which surfaced as a far higher rate of disk i/o. While this certainly was a concern for improving Dropbox sync performance on Mac, Apogee’s main focus is on catching regressions in Dropbox code itself, so reducing variability won out. Spotlight was banned from our test environment.
Results
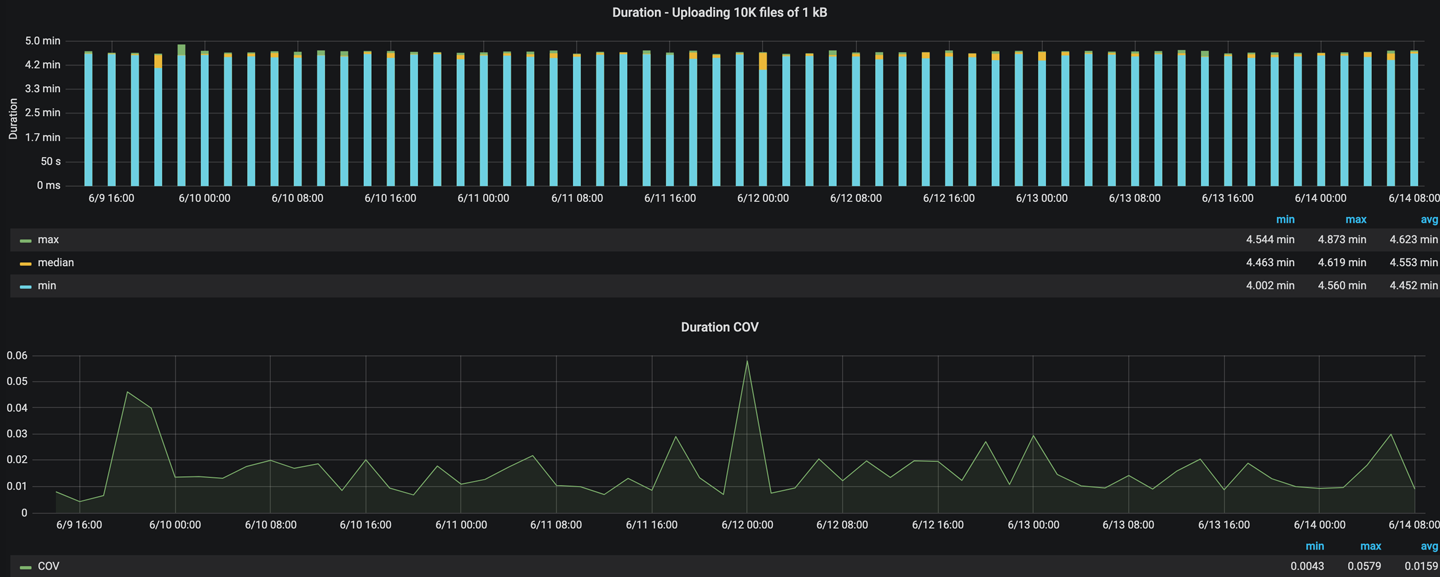
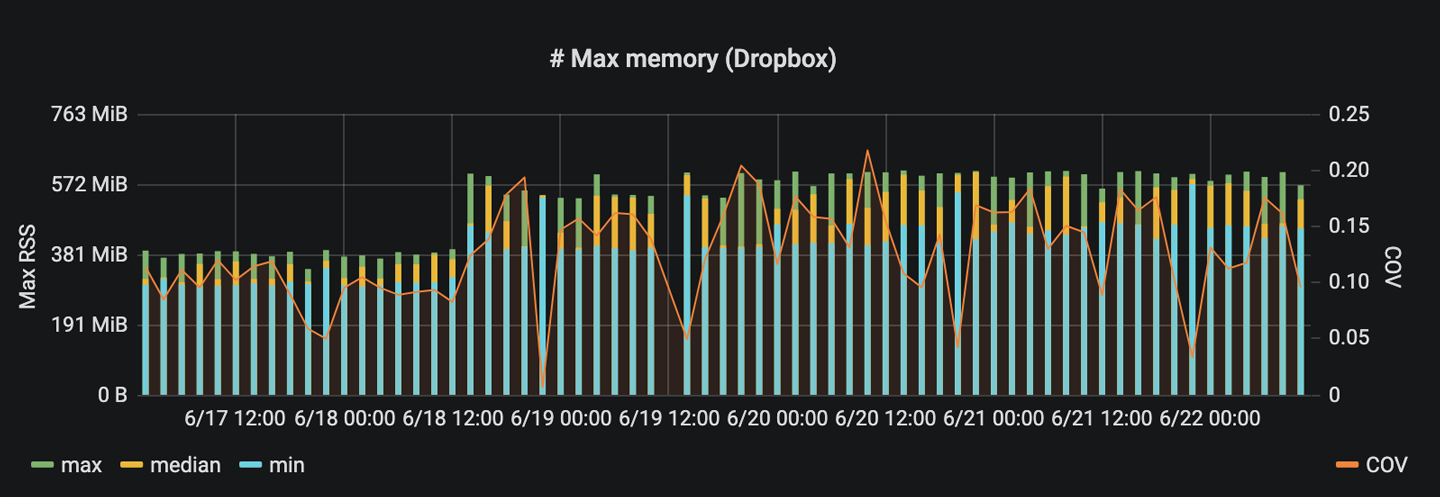
With all the work above, we were able to get the variability down from 60% in the worst case to less than 5% for our all of our tests. This means we can confidently detect 5% or greater regressions. We were able to improve this further by rejecting one outlier per five runs of a test to give us more confidence when alerting on regressions. While we used this scheme in our alerting, we still wanted to graph the outliers as they can often point out systemic regressions and faults in our infrastructure. We built a comprehensive dashboard that developers could use to diagnose what was going wrong in test runs.
Caught regressions
Now let’s walk through some our favorite regressions that Apogee caught for us.
- Slowdown coming from using a third party hash map implementation, which internally used a weak hashing scheme. This led to correlated entries getting bucketed together and thereby increasing insertion and lookup cost from constant time to linear time.

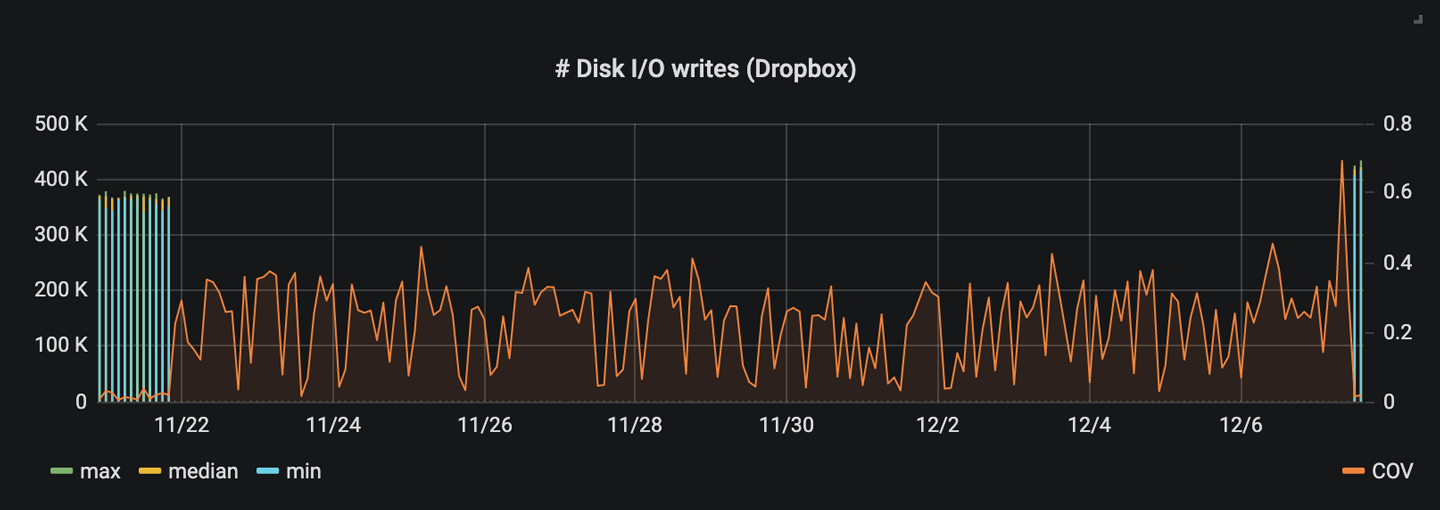
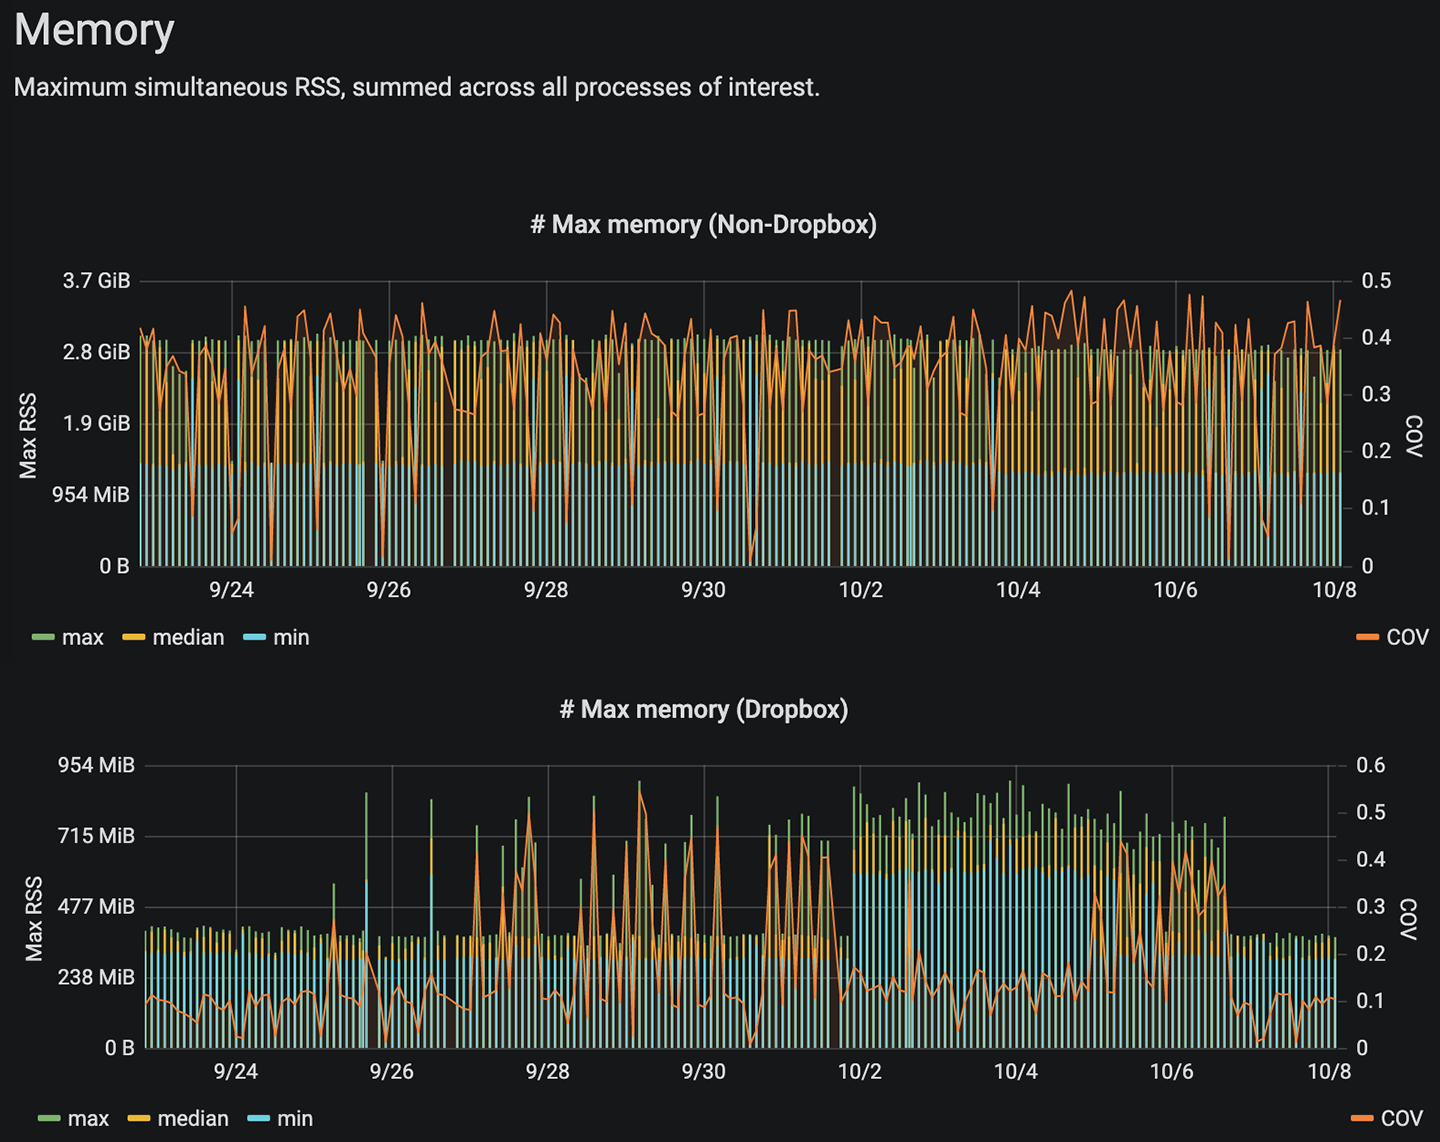
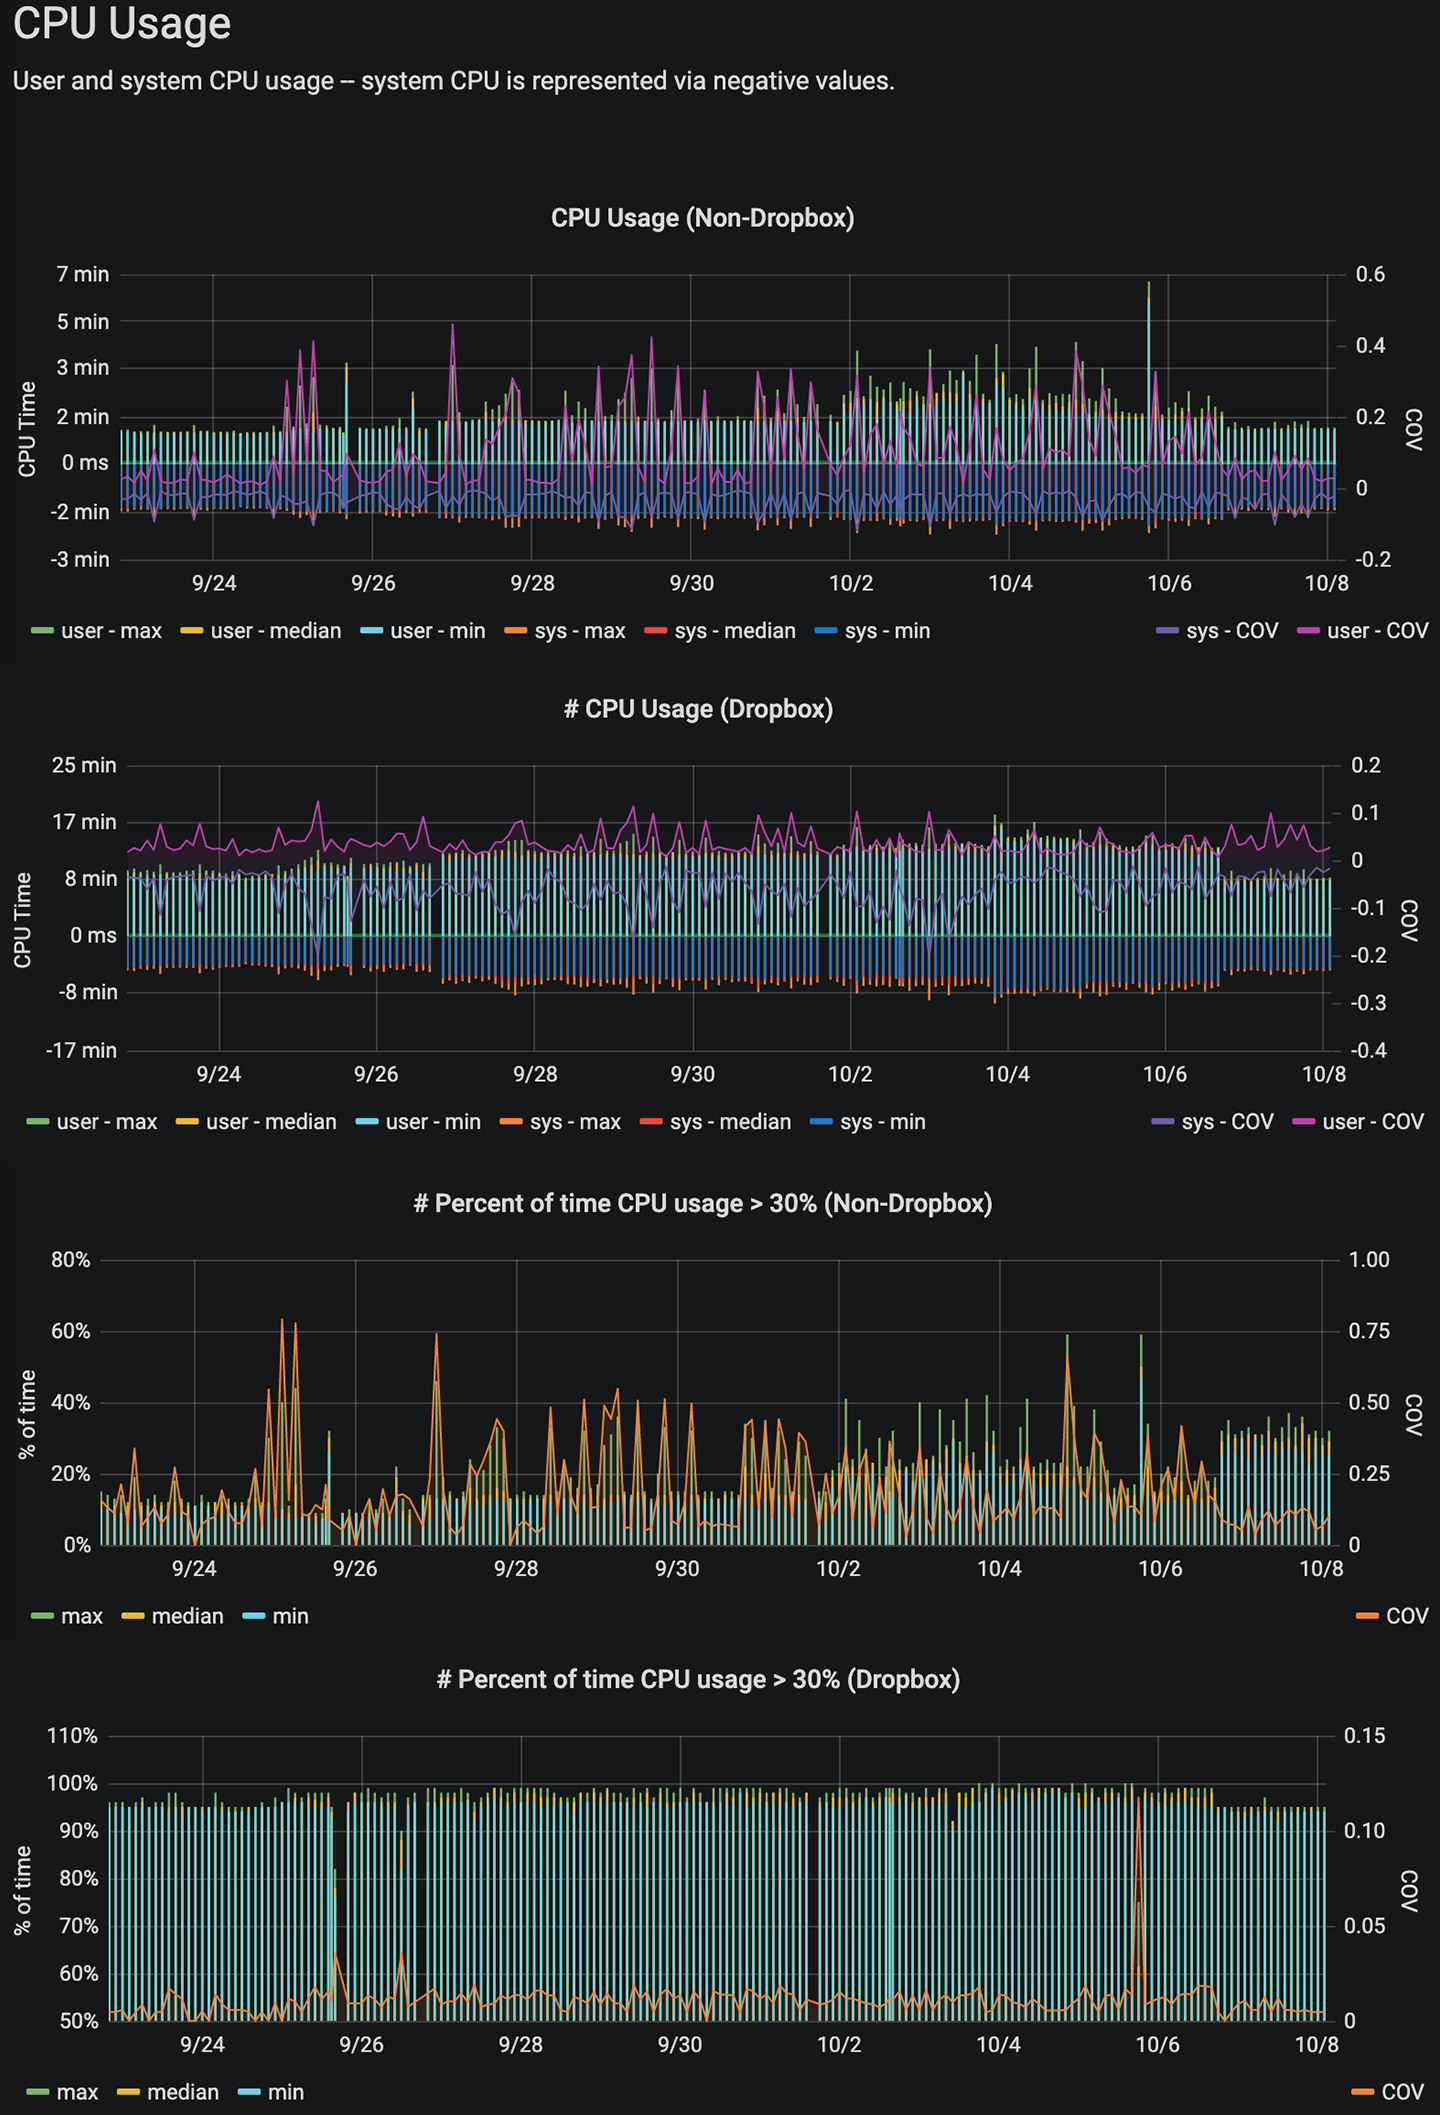
- Using unbounded concurrency leading to a ~50% regression in sync duration coupled with excessive memory and CPU usage

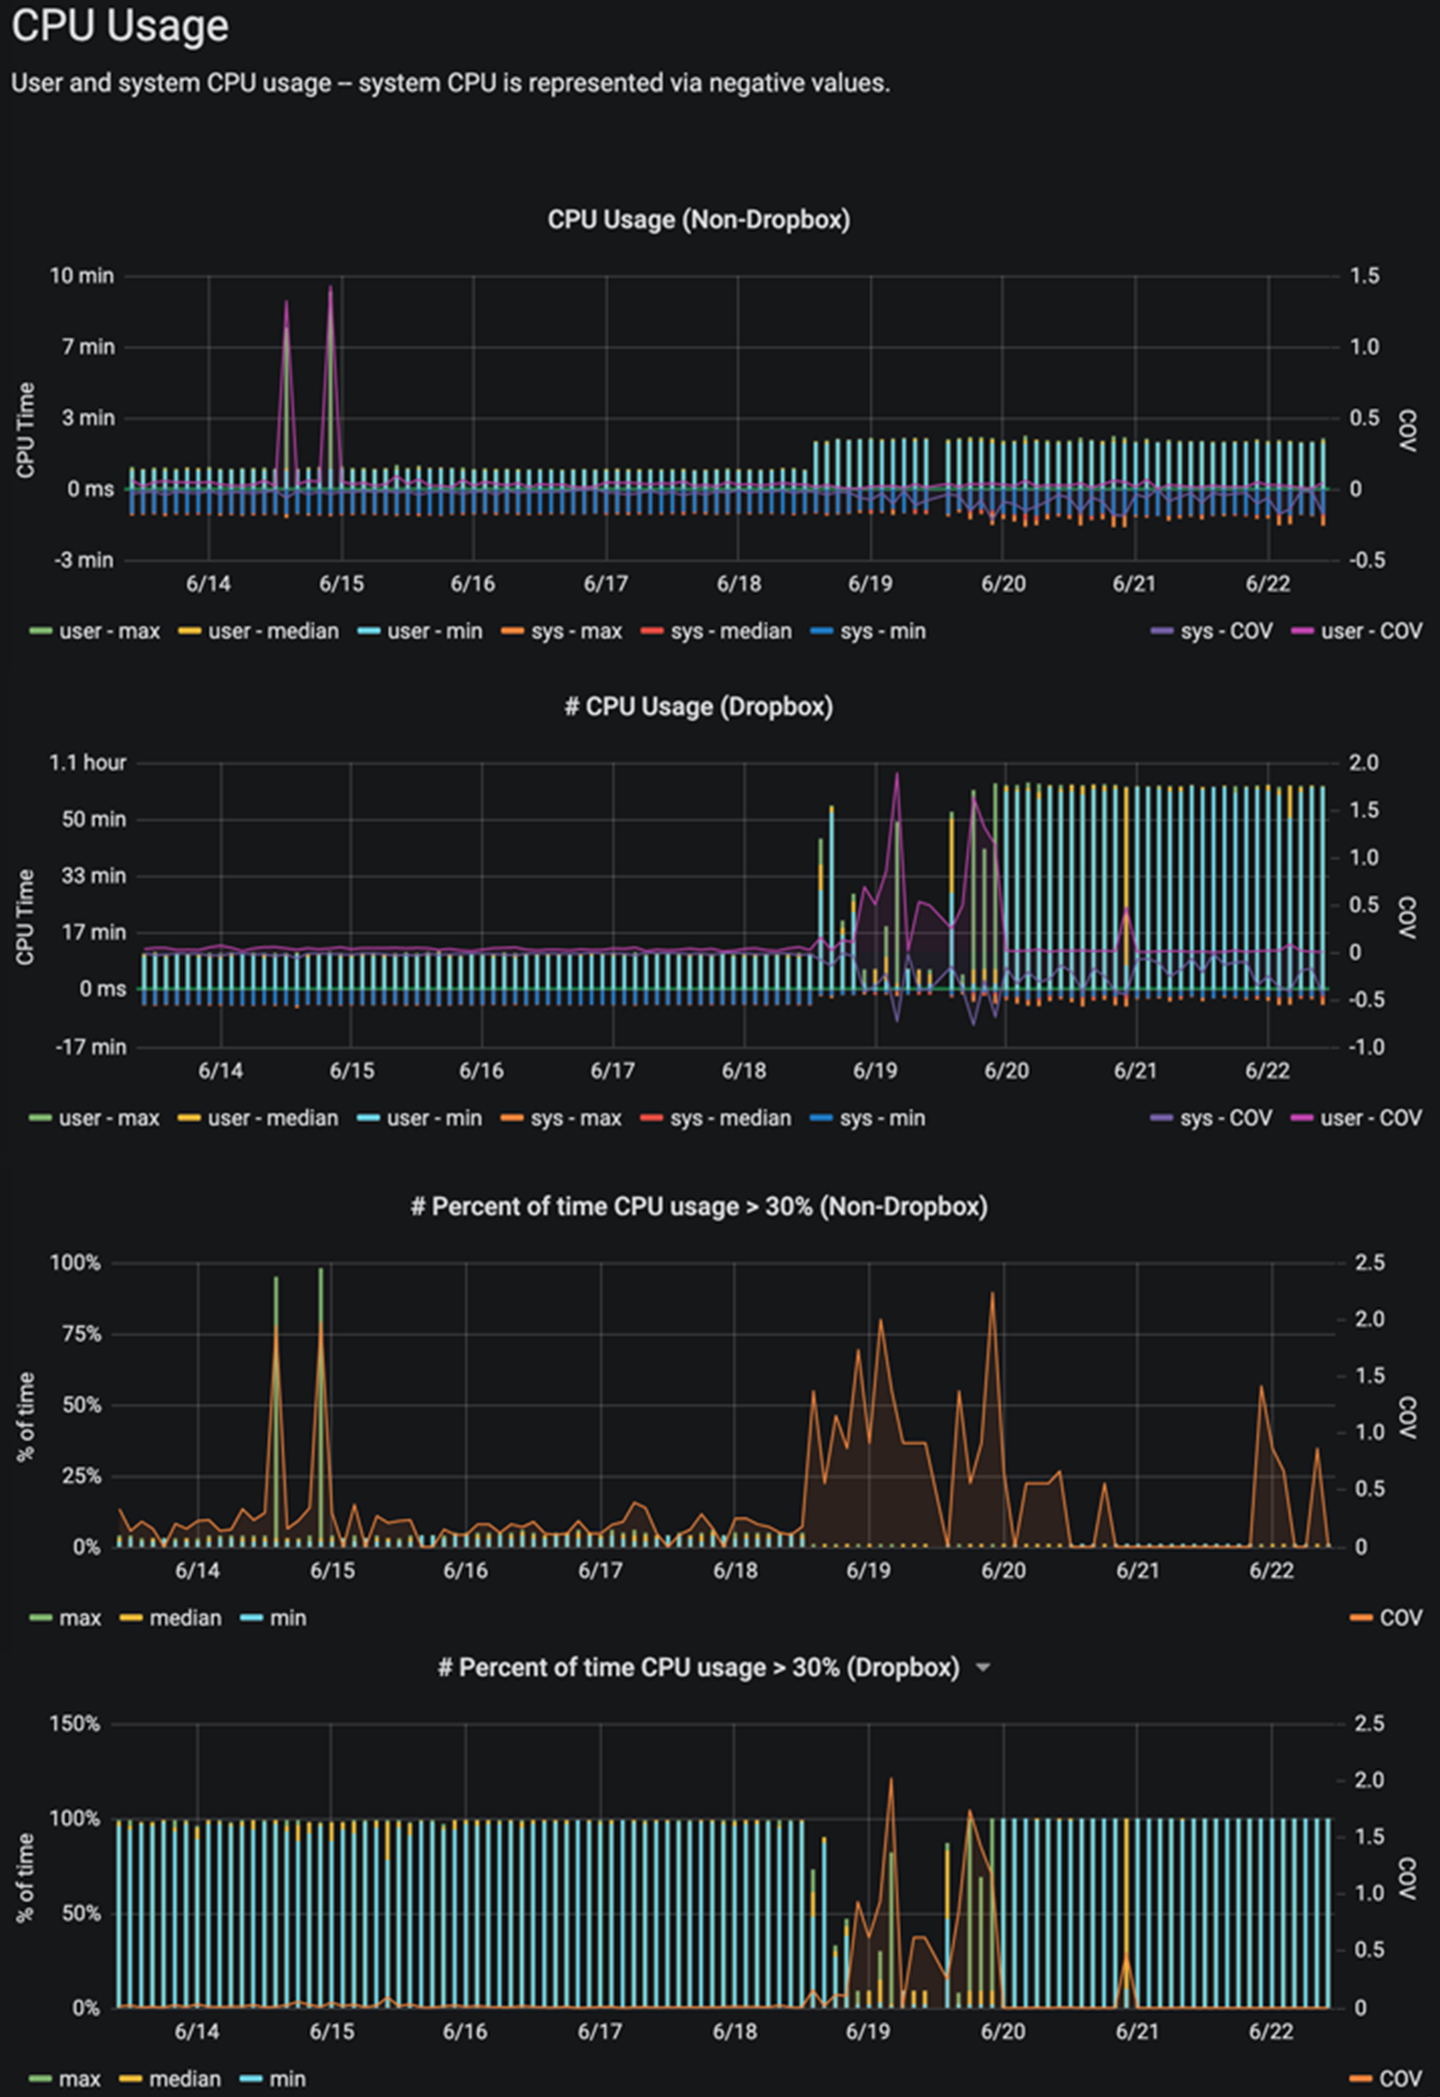
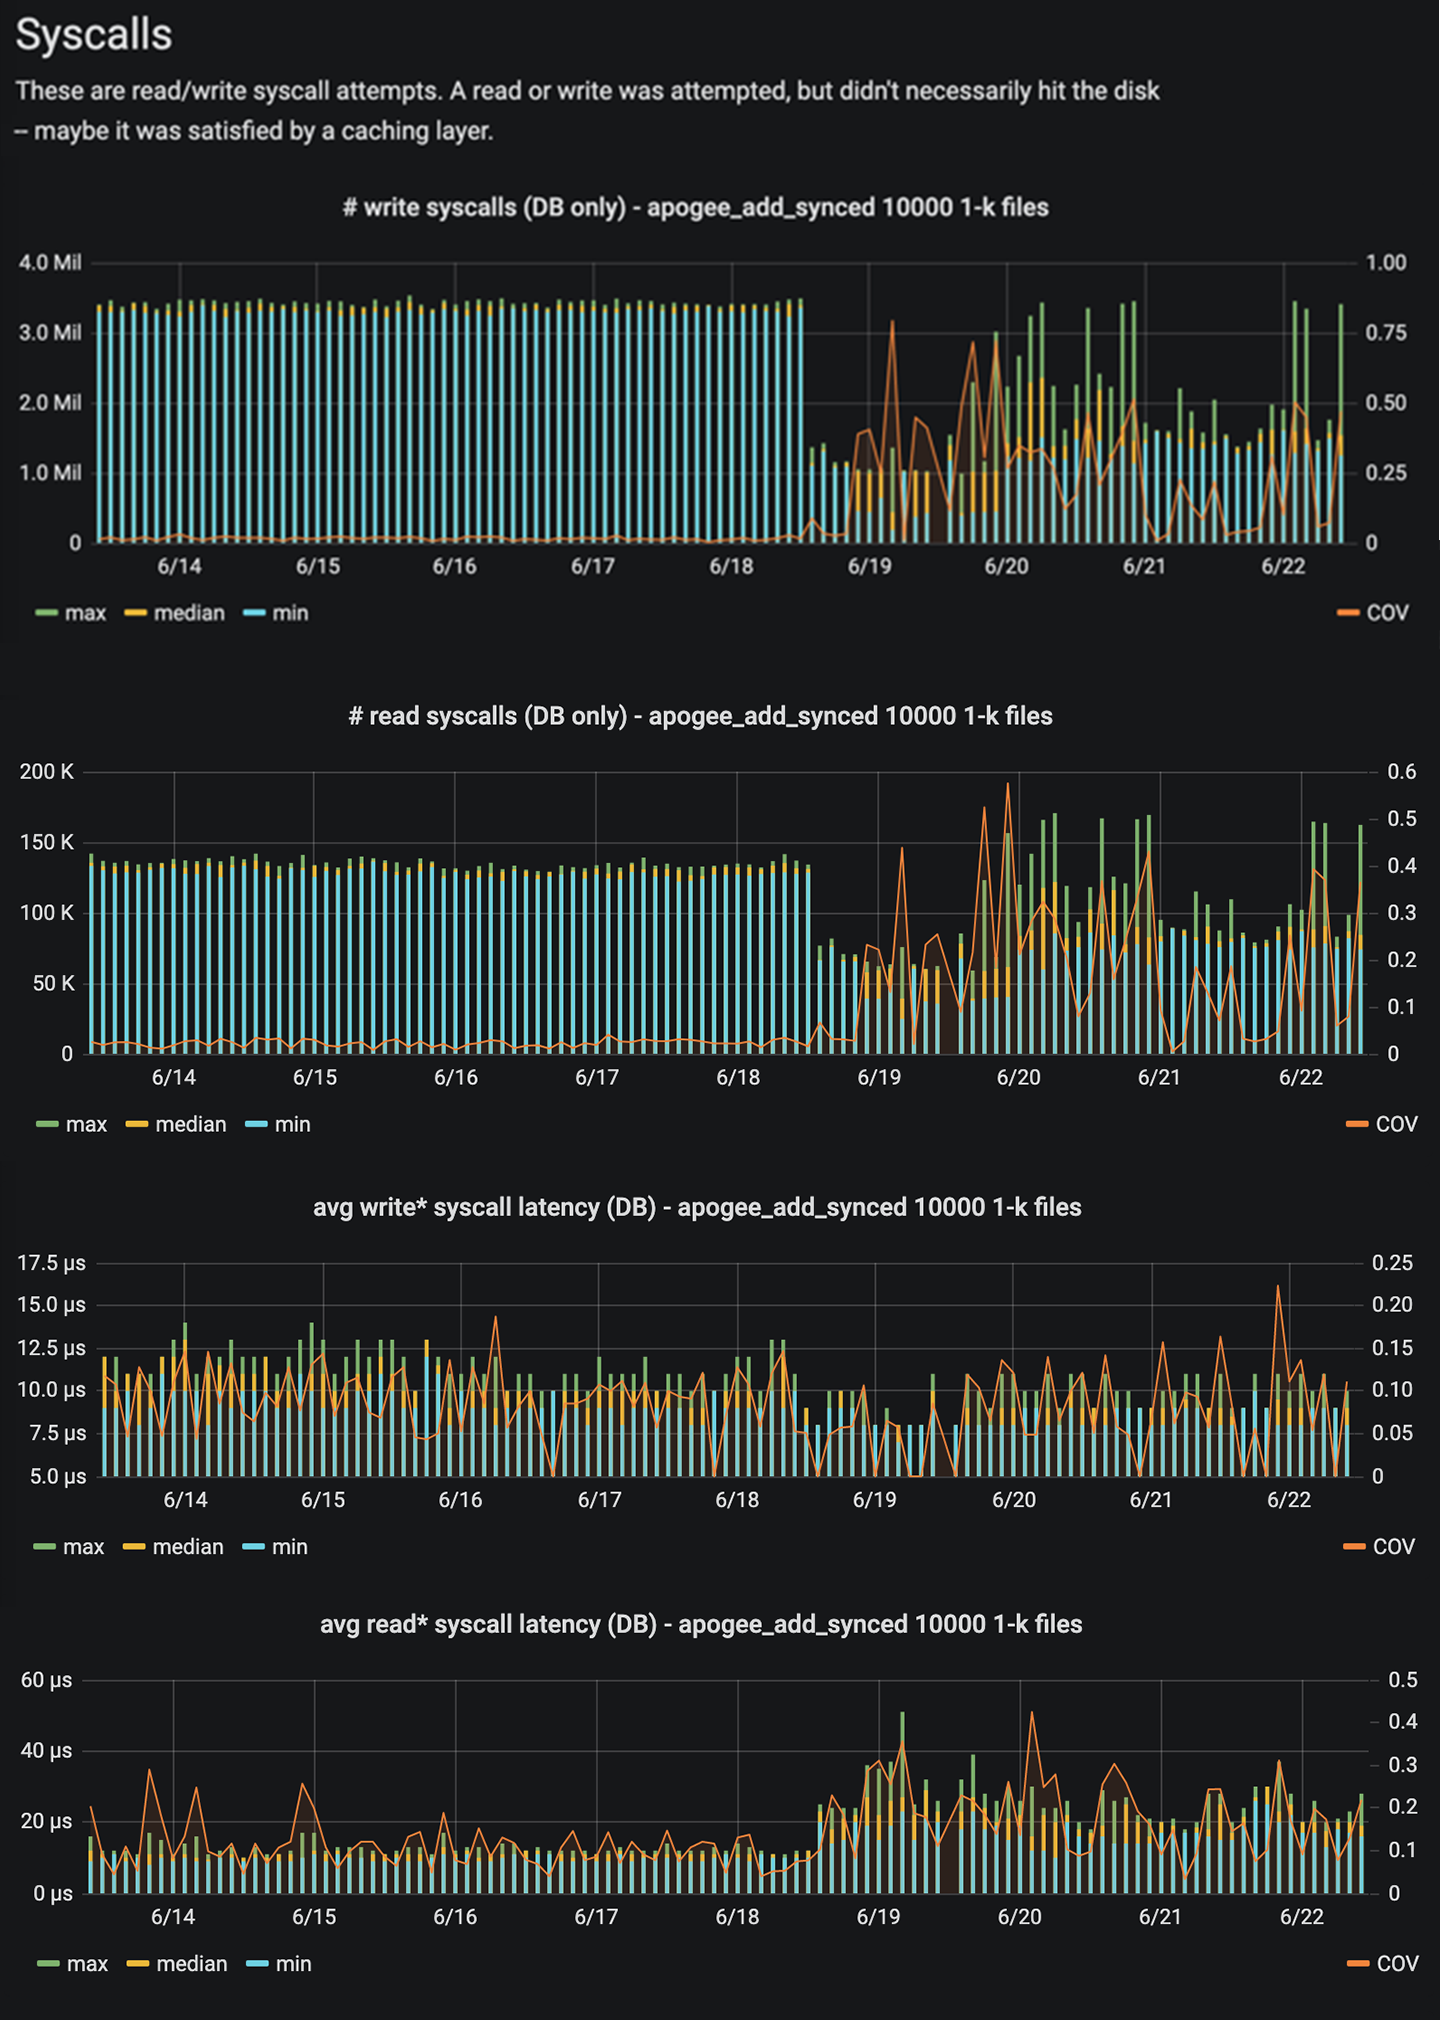
- A sequence of events involving iterating on a set (seeded with an RNG) and removing the element from a map (using the same seed) led to inefficient removal, triggering collisions when the map was resized, ultimately yielding high latency lookups. Possible fixes included resizing more efficiently or using a better map implementation, such as BTreeMap (we ended up using the latter)

- Using incompatible window size and frame sizes for high bandwidth and high latency connections when we first switched to a GRPC powered network stack led to request cancellations under high load


Conclusion
Before Apogee, we only got visibility into performance issues through CX complaints of users hitting pathological cases. Reproducibility is often hard in these situations as you might not have the evidence you need to exactly trigger what the end user might be facing, especially when it comes to performance issues. Even if you do manage to find the cause, fixing regressions weeks (or sometimes months) after the offending code was originally pushed is time consuming as you need to rebuild all the context. You could have multiple commits building on top of the main issue that could make it challenging to simply revert the code. If this bug is in the data model or persistence layer then you might be forced to run an expensive migration to fix it. Apogee sidesteps this unpleasant flow by warning us of performance regressions before they affect even a single customer. It goes a step further by providing clear evidence in the form of logs and other supplementary metrics. Engineers can run the performance test locally on their development machine to reproduce the issue, inspect the state of the sync engine in real time, and follow up with targeted benchmarks to zero in on the root cause.
Apogee has also been crucial in finding faults in Dropbox code that only come at scale. It has helped us catch long-standing bugs, and identify regressions added to various areas within the sync engine. The examples mentioned above include pointing out inefficient ways of storing data, finding limitations in our asynchronous and concurrent code, catching bugs in third party libraries, and helping us roll out a brand new network stack. Apart from finding regressions and confirming the fixes, the system also constantly validates new performance improvements we make and then holds us accountable to that newly set bar.
Future work
Over the course of the sync engine rewrite we made tremendous progress in the testing realm and we now have several stable and proven frameworks for testing sync. While Apogee tests sync at a very high level, we are now adding performance testing at the lower level testing layers. These tests are cheaper to write, run, and manage. It allows us to be more sophisticated in our testing because we have a lot more visibility into what the sync engine is doing.
Acknowledgements
We want to acknowledge all the previous and current members of the sync team and the emeritus of the sync performance team, specifically Ben Newhouse and Marc Sherry. We want to also thank the members of the partner teams that supported us in the process of building this system.

