

Like many companies, Dropbox runs experiments that compare two product versions—A and B—against each other to understand what works best for our users. When a company generates revenue from selling advertisements, analyzing these A/B experiments can be done promptly; did a user click on an ad or not? However, at Dropbox we sell subscriptions, which makes analysis more complex. What is the best way to analyze A/B experiments when a user’s experience over several months can affect their decision to subscribe?
For example, let’s say we wanted to measure the effect of a change in how we onboard a new trial user on the first day of their trial. We could pick some metric that is available immediately—such as the number of files uploaded—but this might not be well correlated with user satisfaction. We could wait 90 days to see if the user converts and continues on a paid subscription, but that takes a long time. Is there a metric that is both available immediately and highly correlated with user satisfaction?
We found that, yes, there is a better metric: eXpected Revenue (XR). Using machine learning, we can make a prediction about the probable value of a trial user over a two-year period, measured as XR. This prediction is made a few days after the start of a trial, and it is highly correlated with user satisfaction. With machine learning we can now draw accurate conclusions from A/B experiments in a matter of days instead of months—meaning we can run more experiments every year, giving us more opportunities to make the Dropbox experience even better for our users.
 Dropbox Dash: Find anything. Protect everything.
What is XR?
To create a metric that is both (1) highly correlated with user satisfaction and (2) can be calculated after only a few days, we use machine learning to model the expected revenue (XR) from individual users and business teams. We know that when users pay for a subscription, they are receiving value from Dropbox. Revenue is highly correlated with satisfaction. Specifically…
- XR = (Probability to Spend) × (Predicted Amount)
The model accounts for the likelihood a customer will (a) convert from a trial to a paid subscription, (b) be retained as a customer, and (c) switch to a different plan or payment period (either monthly or annual). The predicted amount is the two-year lifetime value of a customer.
With only a few days of data, XR gives us the ability to answer questions like:
- Did this experiment yield more annual subscriptions than monthly subscriptions?
- Does an increase in Advanced Team signups outweigh a reduction in overall trial starts?
- If we identify users that are accidentally signing up for a business plan, will they be happier if we recommend them an individual subscription?
Building a model for XR depends on knowing the Lifetime Value (LTV), or the total amount a typical customer may spend with us. But whereas the LTV is an average across our customer base that is used for high-level business decisions, XR is specific to each user, and is used to understand the detailed mechanics of our business. XR can be used for evaluating A/B experiments, for weekly business health monitoring, and for identifying opportunities to better customize our product for specific use cases.
We calculate XR each day for the first 45 days after a trial starts, and the precision and accuracy of the model improves the more data we collect. This allows us to make a trade-off between how long we wait to calculate XR and how accurate our calculation is. We segment users by trial type and geography, and we use Gradient Boosted Trees algorithms in TensorFlow to train conversion probability and revenue regression models.
To achieve a closer agreement between the model output and the actual two-year revenue, we perform a calibration as a function of the trial day, the plan type, and the geographical region. We take the average residual between actual revenue and model output in training data as a correction that we apply to the model output. When we do this, we find that the resulting XR value is typically within 5% of the actual two-year revenue on a weekly basis.
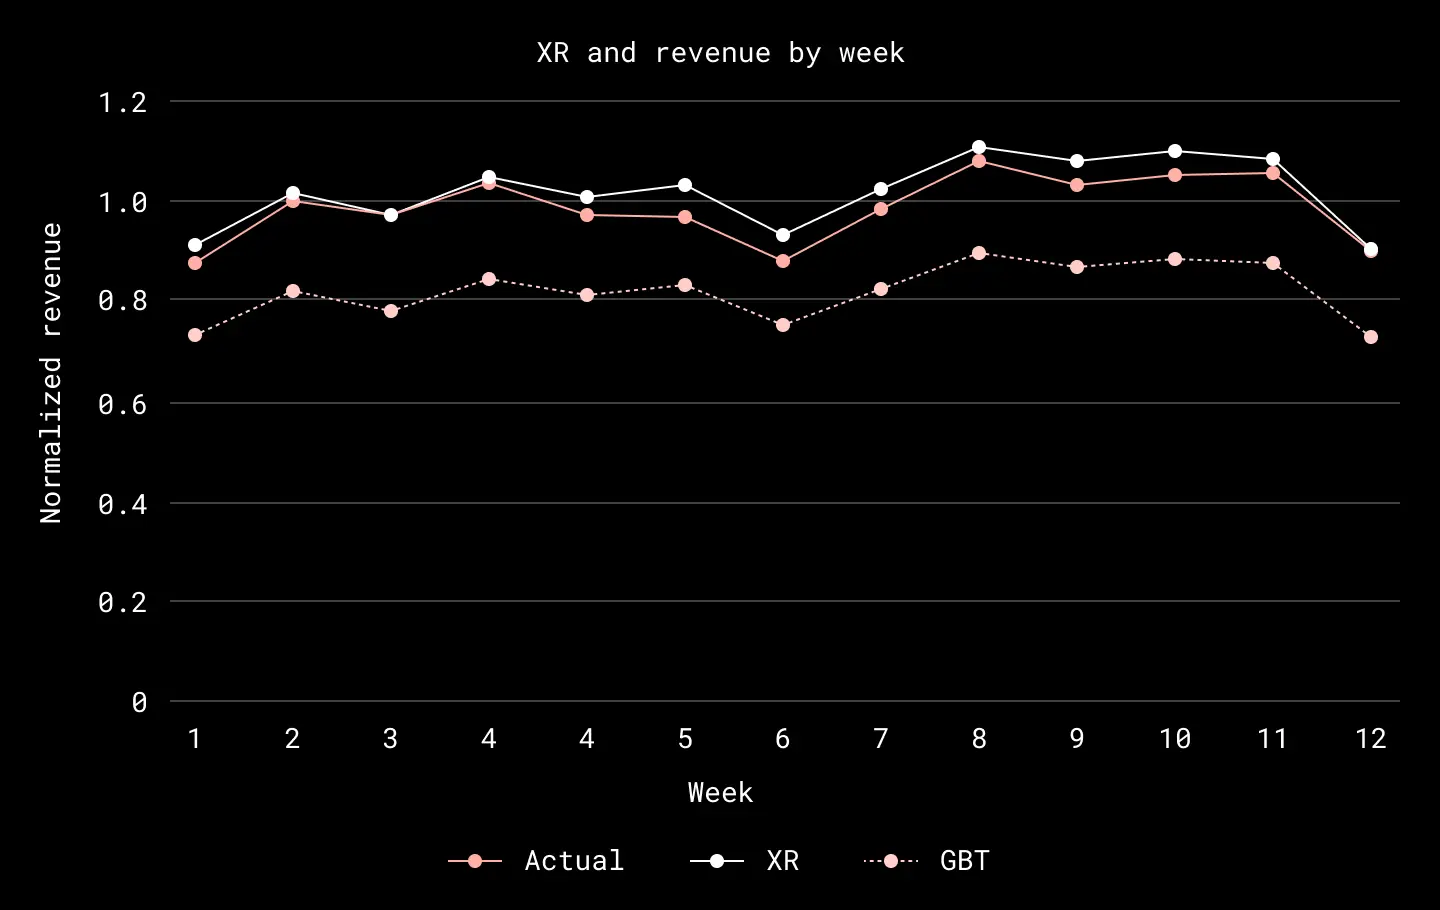
XR, actual revenue, and gradient boosted trees (GBT) model output (all normalized) as a function of week in 2022, calculated for users starting Plus trials in North America. XR is calculated by taking the GBT model output and applying an offset correction. XR is typically within 5% of the actual revenue on a weekly basis
We evaluate XR values for new subscription trials and purchases on a daily basis. The orchestration of the daily job is done using Airflow, and the backend is a Hadoop cluster on top of Amazon Web Services (AWS). Our data lake, available to analysts and used to store both input signal data and output XR values are stored and accessed using Hive. The TensorFlow models are persisted on Amazon S3 and accessed using our own Model Store API. This API not only provides the persisted models, but also feature encoding and calibration constants as well. The evaluation itself is executed using Spark.
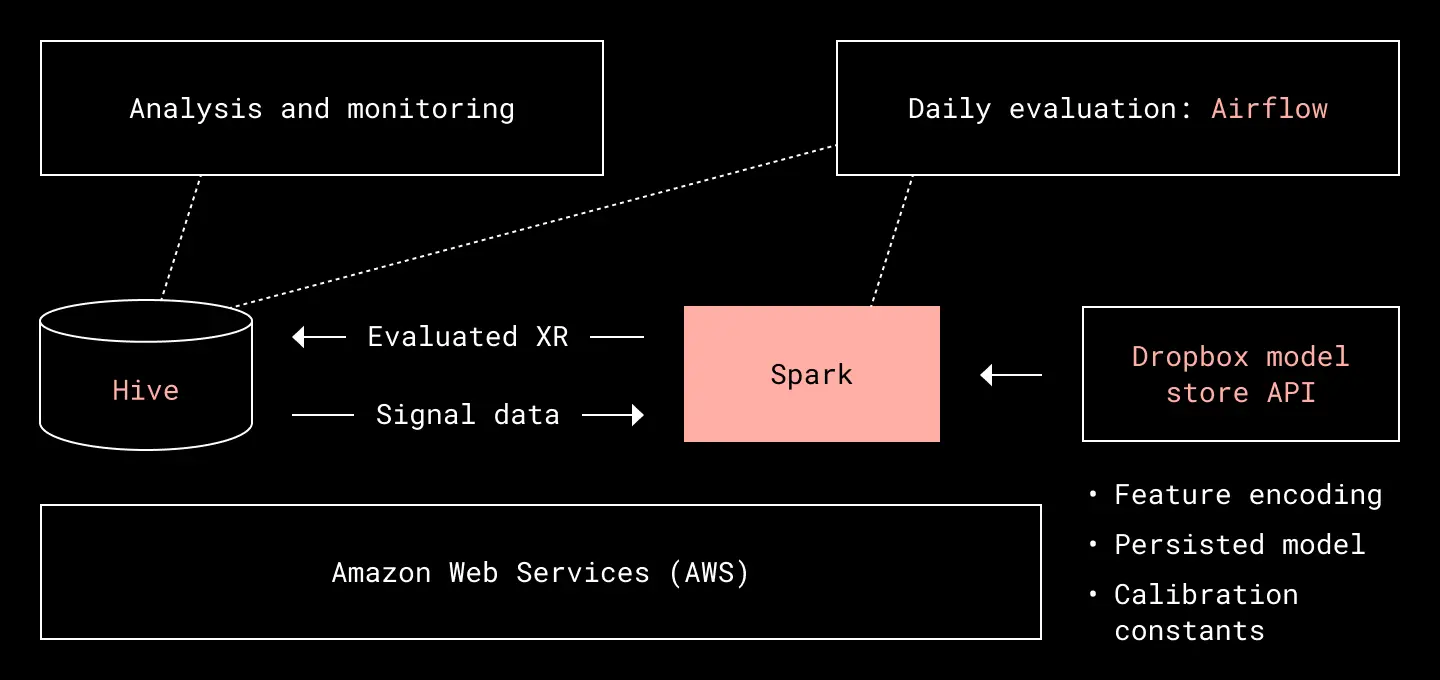
XR evaluation architecture
Why is XR a good metric?
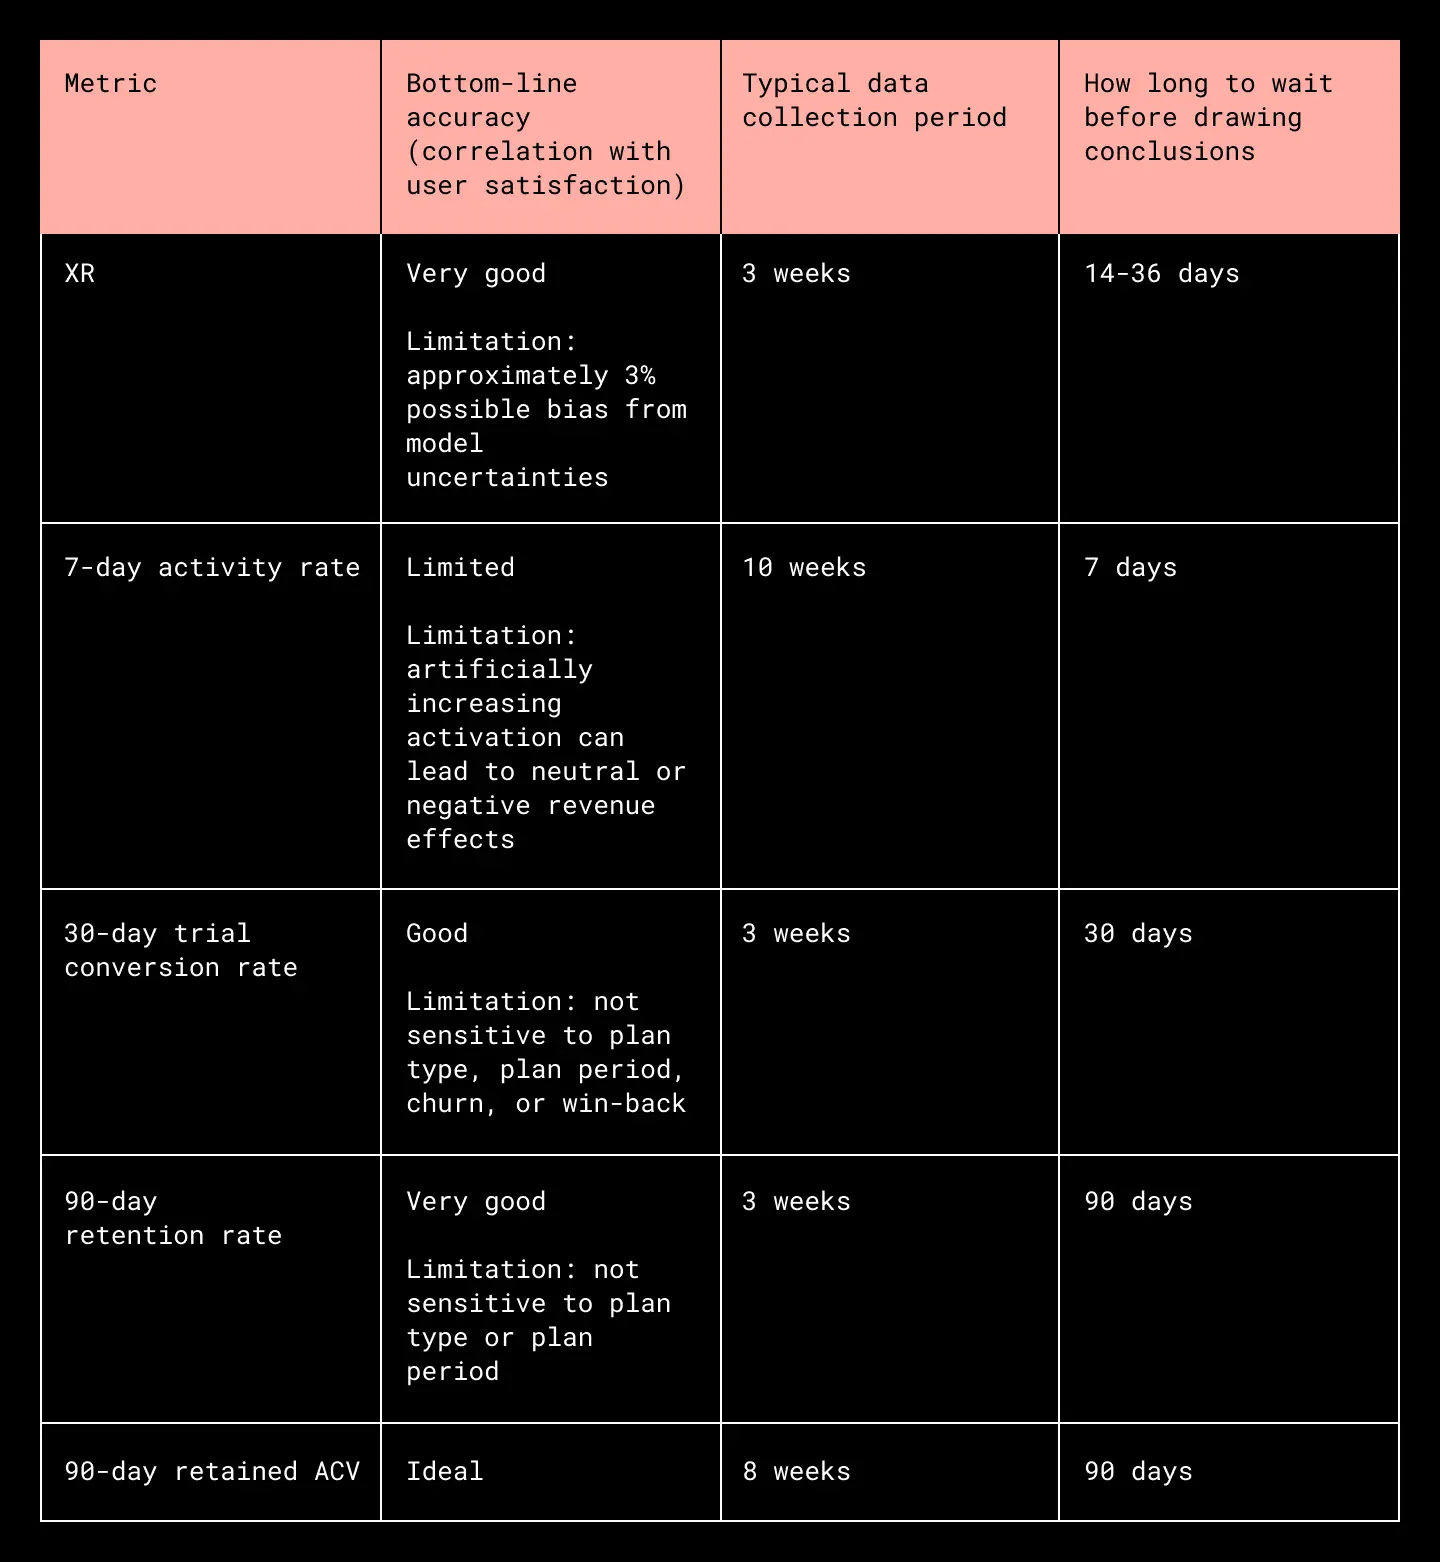
To understand why it’s a good idea to use machine learning to draw conclusions from experiments, consider some alternatives:
- 7-day activity rate. We can construct a metric that is available quickly and directly based on the actions a user takes, such as logging into our web portal or uploading files. However, a metric like this is easy to manipulate, and it can give false impressions. Also, in order to achieve a significant correlation, it may require significantly more data (not every user will perform the specified actions).
- 30-day trial conversion rate. If we wait 30 days, we can see how many users convert from a trial to a paid subscription. However, this does not account for retention/churn, plan switching, and different payment schedules.
- 90-day retention rate. If we wait 90 days, we can improve on the trial conversion rate by including retention/churn effects. However, the length of time to wait is prohibitively long.
- 90-day annual contract value (ACV). If we wait 90 days and take more data, we can measure ACV directly, including the effects of retention/churn and plan switching. But again, the length of time to wait and the amount of data required are prohibitive.
How we use XR to draw conclusions
Using XR to draw conclusions from A/B experiments provides relatively fast calculations that are highly correlated to user satisfaction. It has good statistical sensitivity because we can include all trials in the final estimation, regardless of whether they actually convert or not. To achieve this, we add up the XR values for all the trials in a cohort. The result is a good estimate of the actual revenue that is realized over time.
However, there is a cost to this procedure, as we have to account for potential biases in the model when using it for experimental purposes. Scientists call this the systematic uncertainty, related to the experimental method itself (which is different than the statistical uncertainty, which is related to the size of the dataset). To suppress the systematic uncertainty, we consider the XR lift when drawing conclusions.
When we define the XR lift as the ratio XRB/XRA, and the actual revenue lift as RB/RA, we can see that:
XRB/XRA =
(RB + ϵ1) / (RA + ϵ2) ≈ (RB/RA) x (1 + 𝒪((ϵ/R)2)) = (RB/RA) x (1 + 𝒪(1%))
This assumes that the actual revenue is R ≈ RA ≈ RB, the difference between the actual revenue and XR is ϵ ≈ ϵ1 ≈ ϵ2, and (ϵ/R) ≤ 10%.
In other words, taking the ratio of XR values reduces the systematic uncertainty to a few percent.
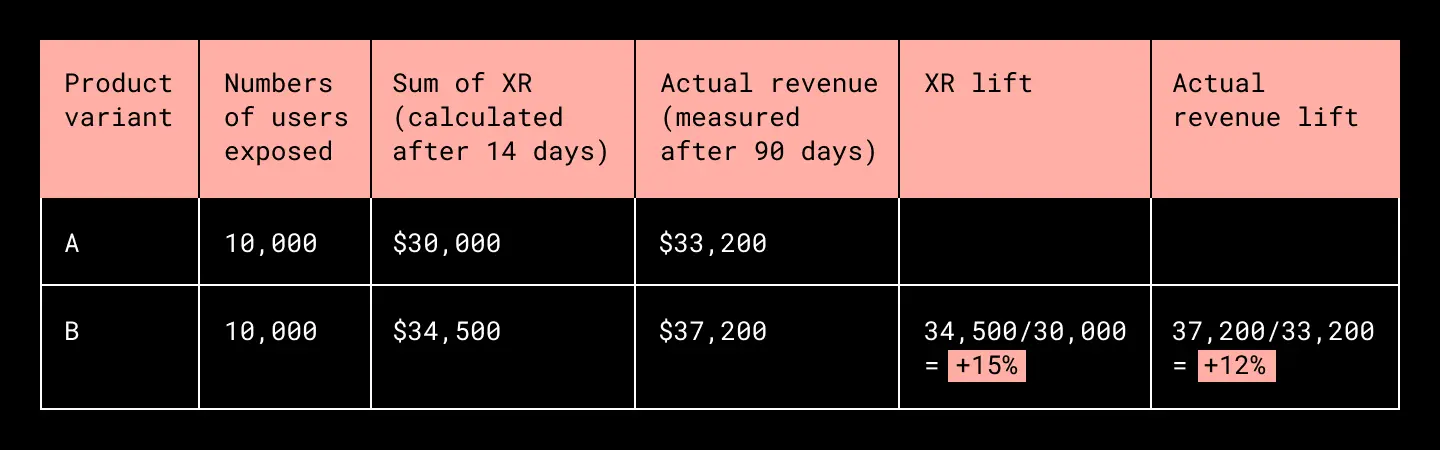
We estimate the size of the systematic uncertainty by back-testing the method on experiments that have been concluded for enough time to measure actual revenue. By comparing the XR lift with the actual revenue lift for a basket of experiments, we find that the systematic uncertainty due to using this model is ~3%. What this means is that if we measure an XR lift that is less than 3% from unity, we consider the experiment to be revenue neutral, and we use secondary metrics to draw conclusions.
An imaginary XR analysis is shown below. We see that despite a difference of ~10% between XR and actual revenue, the XR lift only differs from actual revenue lift by ~3%.
What’s next
Now that we’ve successfully demonstrated how machine learning can be used to draw conclusions from A/B experiments, we we will be able to run more experiments every year. And because XR takes different plan types, payment periods, and possible upsell/downsell into account, we will have more confidence in the product changes we make.
In addition to being able to make experimental decisions, we can analyze the model to gain insight into drivers of customer intent. We can also monitor the health of our business by tracking XR values across our business weekly, allowing us to proactively identify environmental changes, opportunities, and problems. And we are undertaking analyses of the change in XR over time, which will give us insight into specific actions that occur that alter a user’s satisfaction with our products.
Finally, we want to thank the people and teams who released this module into production: Ashwini Chaube, Lin Yu, Felicia Liu, Reza Rahimi, Dany Jradi, Nicole Won, the Machine Learning Go-to-Market team, the Growth Data Science team, and the Machine Learning Platform team.
If building innovative products, experiences, and infrastructure excites you, come build the future with us! Visit dropbox.com/jobs to see our open roles, and follow @LifeInsideDropbox on Instagram and Facebook to see what it's like to create a more enlightened way of working.


