Application startup is the first thing our users experience after they install an app and then again every single time they launch it. A simple and snappy application brings users a lot more joy than an application that has a ton of features but takes an eternity to load. Realizing this, Dropbox Android team has invested in measuring, identifying, and fixing the issues that were affecting our app startup time. We ended up improving our app start time by 30%, and this is the story of how we did it.
Scary climb
Historically at Dropbox we have been tracking app start by measuring how long it took from the moment a user taps our app icon up until the moment the app was fully loaded and ready for user interactions.
We abstracted away the measurement for app initialization in the following way:
perfMonitor.startScenario(AppColdLaunchScenario.INSTANCE)

// perform the work needed for launching the application

perfMonitor.stopScenario(AppColdLaunchScenario.INSTANCE)
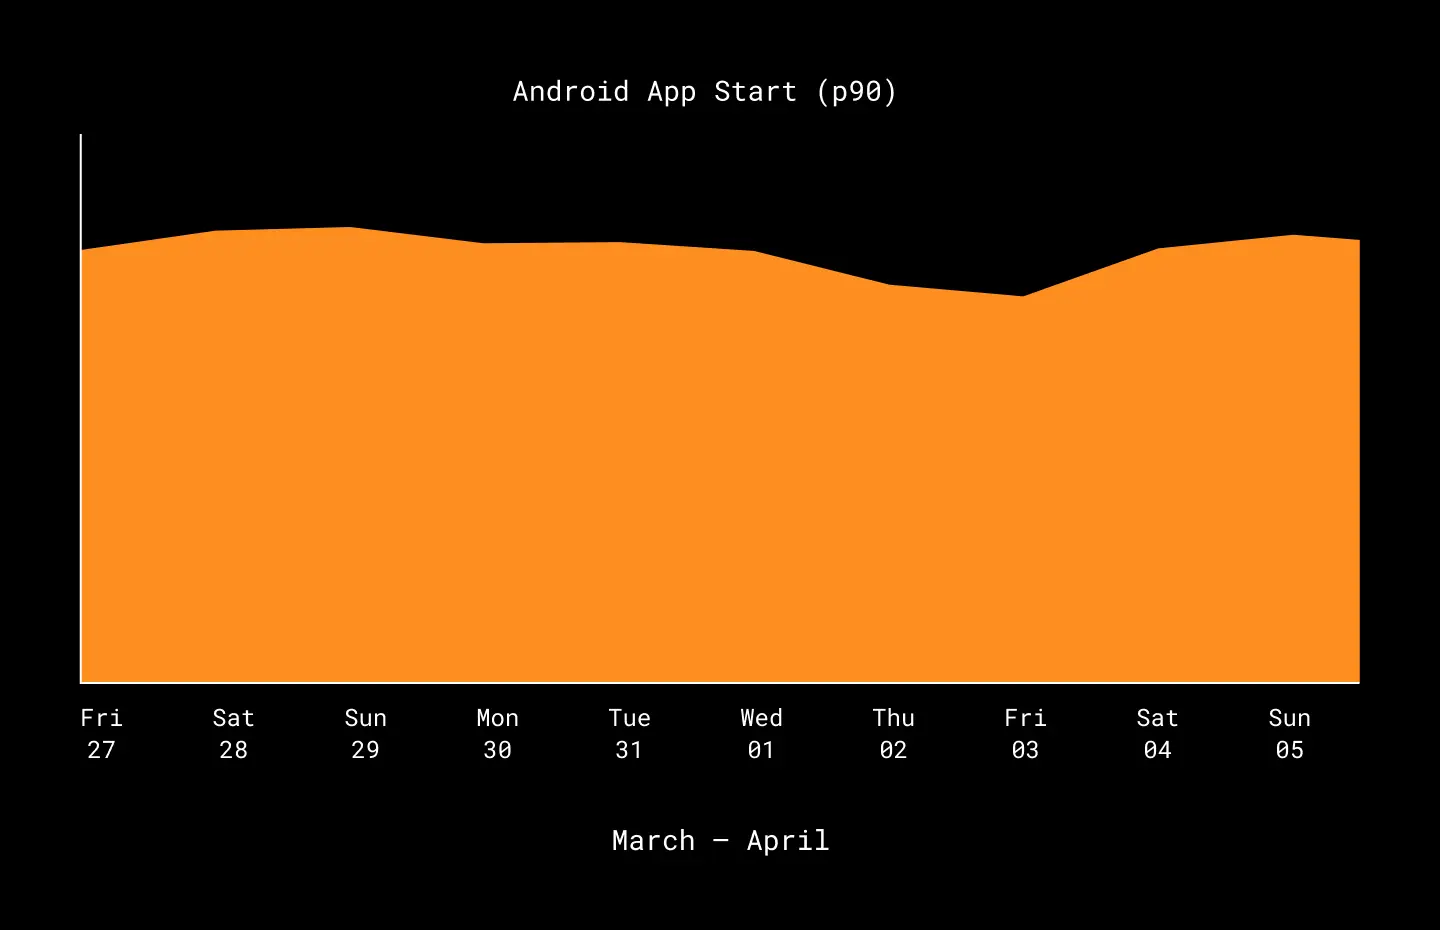
Being a data-driven team, we have been tracking and monitoring the app initialization with the help of graphs accessible to all engineers. The graph below shows app startup p90 measurements from late March to early April 2020.

As you can see in the graph, the app startup time does not seem to be changing that much. Small fluctuations in app startup that range a couple milliseconds are expected in an application used by millions of users with variety of devices and OS versions.
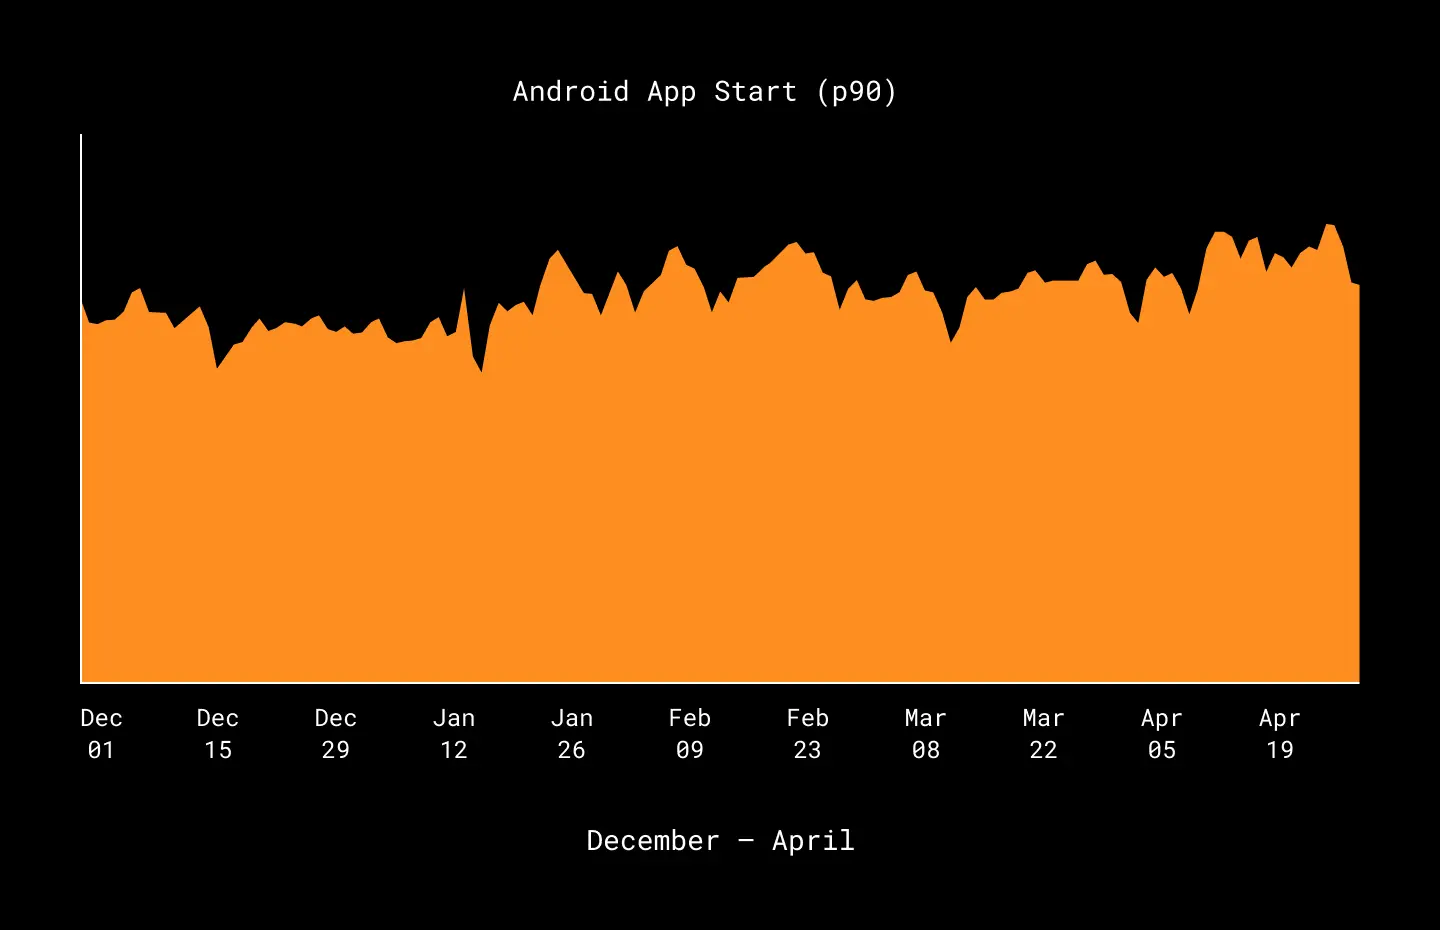
However, when we looked at the app startup time from December 2019 to April 2020, we saw a different picture. The app startup time has been creeping up for months as the app evolved and more features got added. However, because our charts were only showing us changes over a two week period, we missed the slow creep of app startup time that was happening over several months.

While the discovery of the slowly increasing startup time was accidental, it caused us to dig deeper into the reasons why, as well as make sure that our monitoring, alerting tools, and charts were taking a broader, more cohesive look at our metrics.
Give me more numbers
Some features in the application can be relatively simple to measure, such as how long an API call to the server takes. While other features, such as app startup, are a lot more complicated to measure. App startup requires many different steps on the device before the main app screen is shown to the user and the application is ready for user interaction. Examining our initialization code, we identified the main events that happen during our app initialization. Here are a few of them:
- Run migrations
- Load application services
- Load initial users
We started our investigation by leveraging the profiling tools in Android Studio to measure performance on our test phones. The problem with profiling the performance with this approach was that our test phones would not give us a statistically significant sampling of how well the app startup is actually doing. Dropbox Android application has over 1 billion installs on Google Play Store, spanning multiple types of devices, some of them old Nexus 5s, and others the newest and greatest Google devices. It would be a fool’s errand to try and profile that many configurations. So we decided to measure the different steps of app startup using scenarios and scenario steps in production.
Here is the updated initialization code where we added logging for the three aforementioned steps:
perfMonitor.startScenario(AppColdLaunchScenario.INSTANCE)
perfMonitor.startRecordStep(RunMigrationsStep.INSTANCE)

// perform migrations step wrok

perfMonitor.startRecordStep(LoadAppServicesStep.INSTANCE)

// load application services step

perfMonitor.startRecordStep(LoadInitialUsers.INSTANCE)

// perform initial user loading step

perfMonitor.stopScenario(AppColdLaunchScenario.INSTANCE)
With the measurements instrumented in code, we were able to understand what steps in the app’s initialization were contributing the most to the app startup increase.
Performance offenders we found
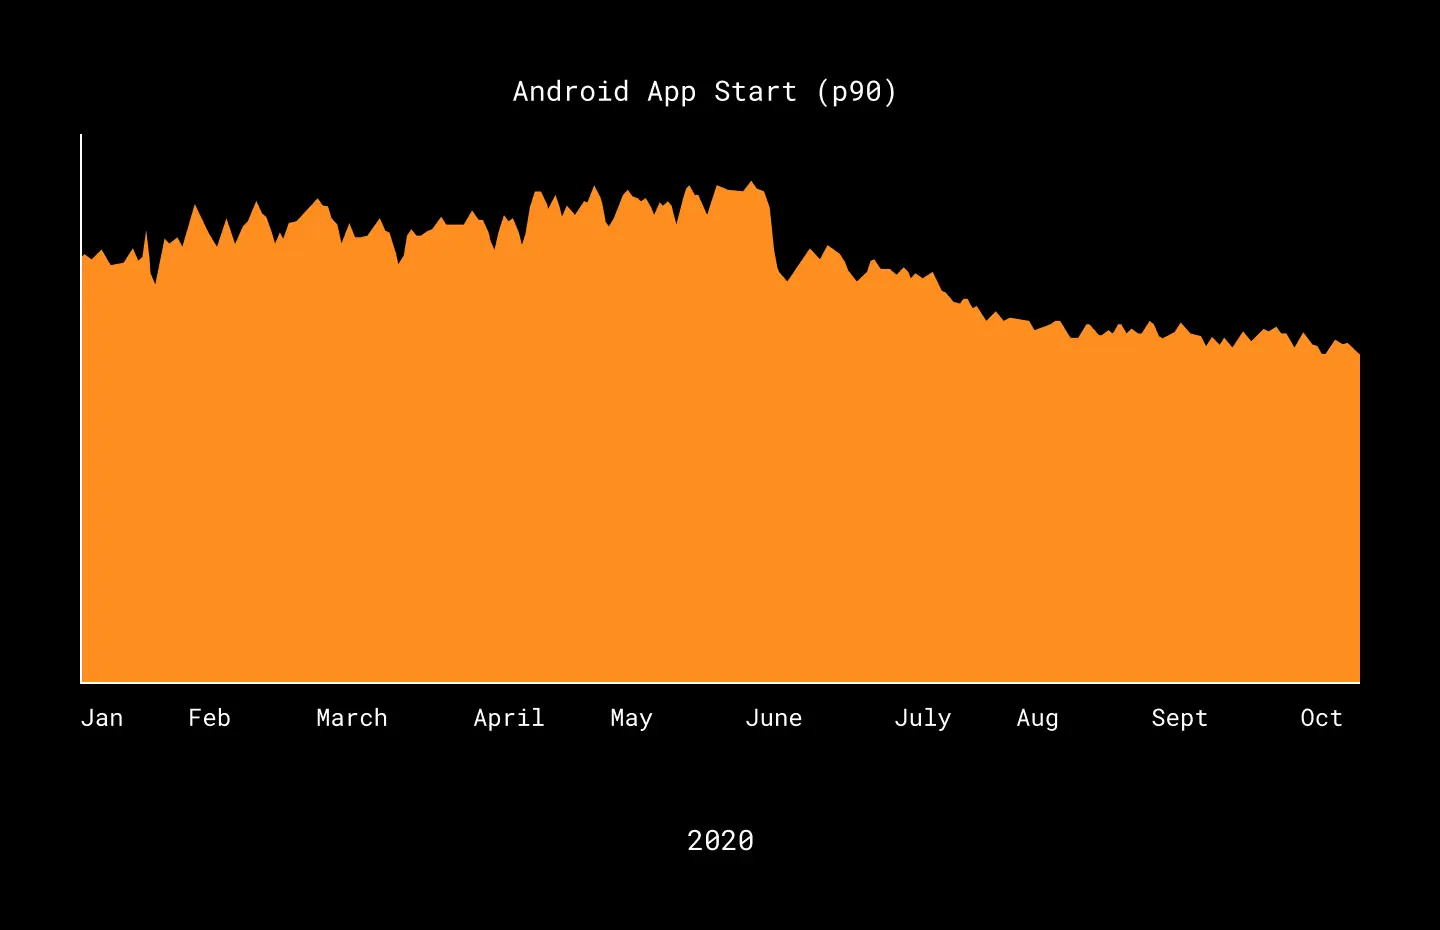
The below graph shows the overall app startup time from January to October 2020.

In May, we introduced measurements for each of the major steps that happen during application initialization. These measurements allowed us to identify and address the largest offenders to the performance of the app startup.

The major app startup offenders included Firebase Performance library initialization, feature flag migration, and initial user loading.
Firebase Performance Library
Firebase Performance library is included in Google’s Firebase suite of products to measure and send metrics about the performance of the apps. It provides helpful functionality such as metrics for individual method performance as well as infrastructure to monitor and visualize the performance of different parts of the app. Unfortunately, Firebase Performance library also comes with some hidden costs. Among them are an expensive initialization process and as a result a significant increase in the build times. In our debugging, we discovered that Firebase suite initialization was seven times longer when Firebase Performance tool was enabled. To fix the performance issue, we chose to remove the Firebase Performance tool from the Android Dropbox application. Firebase Performance library is a wonderful tool that allows you to profile very low level performance details such as individual function calls, but since we have not been using these features, we decided that fast app startup outweighed the individual method performance data, and so we removed the reference to that library.
Migrations
There are several internal migrations that run each time the Dropbox application is launched. These can include updating feature flags, database migrations, etc. Unfortunately, we found that some of these migrations were running at every app launch. We didn’t notice the bad performance of these migrations previously, because the application launched quickly on development and test devices. Unfortunately, this migration code performed especially poorly on older versions of the OS and older devices, contributing to increased startup time. To resolve the issue, we began by investigating which migrations were essential on every launch and which migrations could now be removed entirely from the app. We found and removed at least one migration that was very old and therefore no longer needed, helping get our app start time back on track.
User loading
In the legacy part of our application, we store Dropbox user contacts metadata on the device as JSON blobs. In an ideal world, those JSON blobs should be read and converted into Java objects only once. Unfortunately, the code to extract users was getting called multiple times from different legacy features of the app, and each time, the code would perform expensive JSON parsing to convert user JSON blobs into Java objects. Storing user contacts as JSON was a very outdated design and a part of our monolith legacy code. To get an immediate fix for this issue, we added functionality to cache the parsed user objects during initialization. As we continue working on breaking down the monolith legacy code, a more efficient and modern solution for user contact storage would be to use Room database objects and convert those objects to business entities.
What now?
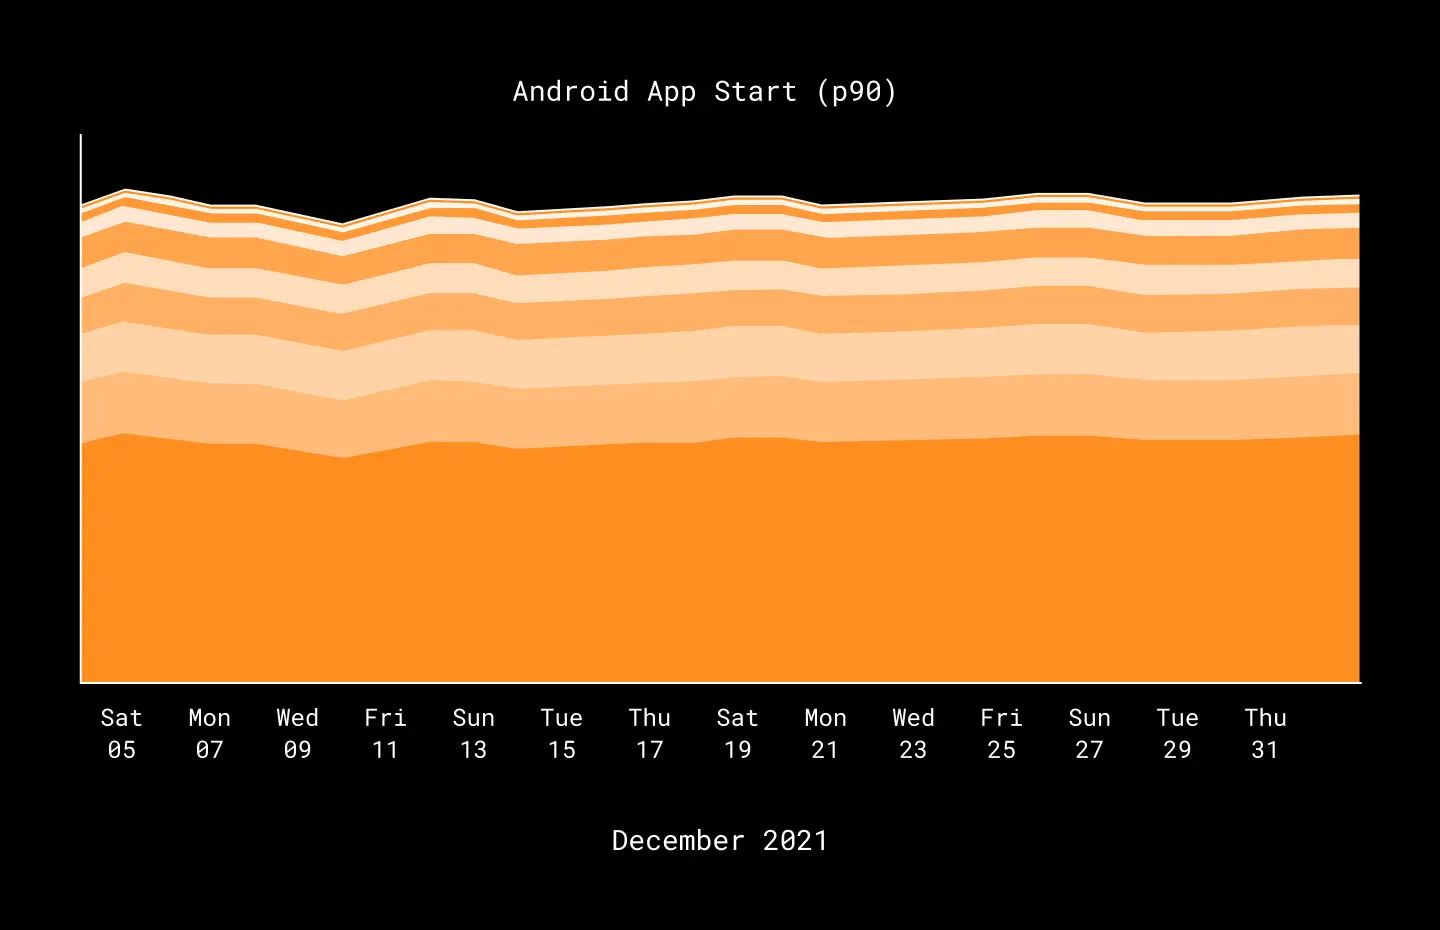
As a result of removing reference to Firebase Performance, removing expensive migration steps, and caching user loading, we improved the app launch performance of the Dropbox Android application by 30%. Through this work, we have also put together dashboards that will help prevent degradation of the app startup time in the future.
We also adopted several practices that will hopefully prevent us from making the same performance mistakes. Here are a couple of them:
Measure app startup performance impact when adding third party libraries
With the discovery of how much Firebase Performance library degraded our app startup, we introduced a process for adding third party libraries. Today, we require measuring the application startup time, build time and the APK size of the application before the library can be added and used in our codebase.
Cache all the things
Since two of the major offenders to the app startup performance had to do with caching, we prefer to cache expensive computations even if it does make the code a bit more complicated. After all, a better user experience is worth a little extra maintenance.
Conclusion
With more investments into credible analytics and performance measuring, we have become a lot more data-driven as a team which allows us to make larger investments into our code base, such as deprecating legacy C++ code, with a lot more confidence. Today, we monitor several dashboards that that provide us insights on performance of the most critical parts of our applications, and have processes in place to ensure that Dropbox applications continue to be snappy and a delight to our users.
Thanks to Amanda Adams, Angella Derington, Anthony Kosner, Chris Mitchell, David Chang, Eyal Guthmann, Israel Ferrer Camacho, and Mike Nakhimovich for comments and review.

