It's almost time for another Hack Week at Dropbox, and with that in mind I'd like to present one of the projects from our last Hack Week.
A profiler is an indispensable tool for optimizing programs. Without a profiler, it's hard to tell which parts of the code are consuming enough time to be worth looking at. Python comes with a profiler called cProfile, but enabling it slows things down so much that it's usually only used in development or simulated scenarios, which may differ from real-world usage.
At our last hack week, I set out to build a profiler that would be usable on live servers without impacting our users. The result, Plop (Python Low Overhead Profiler) is now available on Github.
How it works
Plop is a sampling profiler, similar to Google's gperftools. Every 10 milliseconds, a timer is fired which causes the program to record its current stack trace. After 30 seconds, the collected samples are aggregated and saved. There is a web-based viewer for the resulting call graphs (using d3.js)
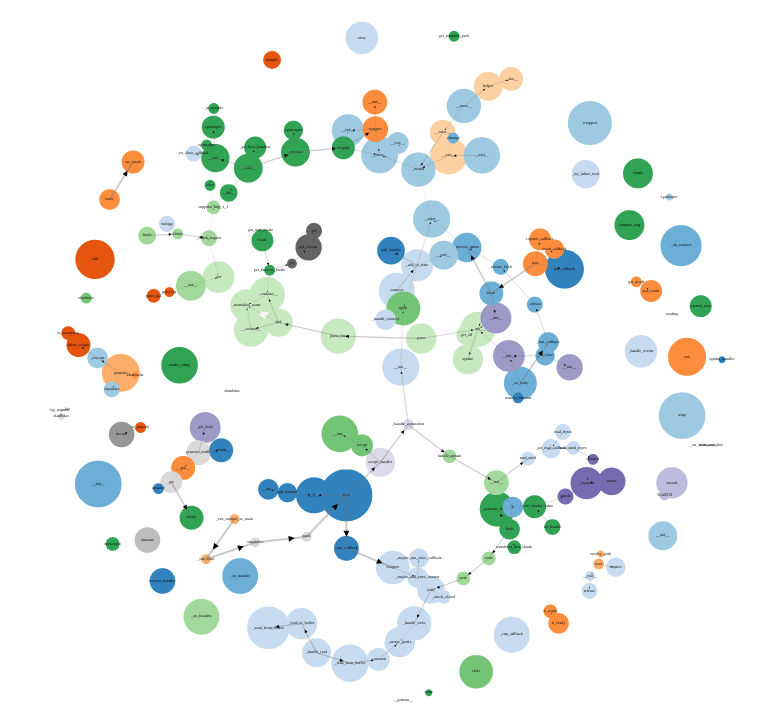
Here's a sample profile, from a simple Tornado-based web server. Click on the image for a full-size interactive view (it's big, so you'll need to either scroll around a lot or use your browser's zoom controls).

Each bubble is a function; they're color-coded by filename and you can mouse over them for more details. The size of the bubble represents the amount of time spent in that function. The thickness of the lines connecting the bubbles represents how frequently that function call appears on the stack. The disconnected bubbles around the edge are actually common utility functions that are called from many places throughout the code - they're so common that drawing the connections to every function that calls them would make the graph unreadable.
Since hack week, we've integrated Plop into our servers and run it regularly. Every time we push new code to the site, a script collects a profile for the new version. This has proven not to be disruptive, with less than 2% CPU overhead while the profile is being collected. It's still a work in progress (especially the viewer), but has already proven useful in identifying performance regressions.

