Apache Kafka is a popular solution for distributed streaming and queuing for large amounts of data. It is widely adopted in the technology industry, and Dropbox is no exception. Kafka plays an important role in the data fabric of many of our critical distributed systems: data analytics, machine learning, monitoring, search, and stream processing ( Cape), to name a few.
At Dropbox, Kafka clusters are managed by the Jetstream team, whose primary responsibility is to provide high quality Kafka services. Understanding Kafka’s throughput limit in Dropbox infrastructure is crucial in making proper provisioning decision for different use cases, and this has been an important goal for the team. Recently, we created an automated testing platform to achieve this objective. In this post, we would like to share our method and findings.
Test platform

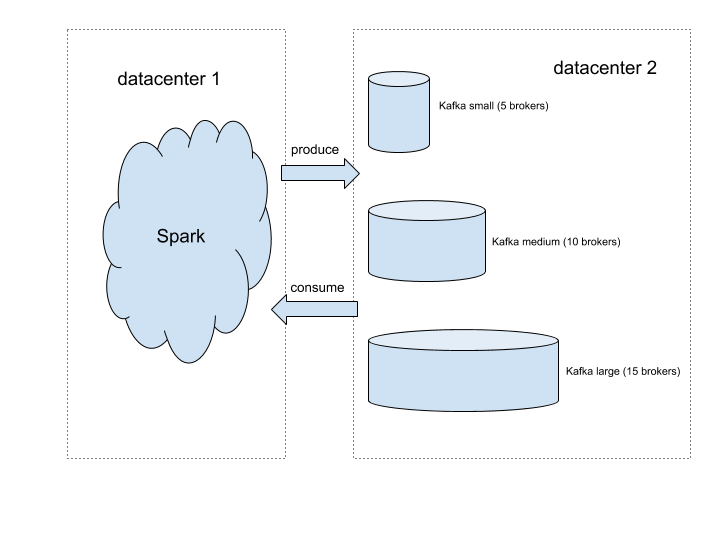
The figure above illustrates the setup of our test platform for this study. We use Spark to host Kafka clients, which allows us to produce and consume traffic at an arbitrary scale. We set up three Kafka clusters of different sizes so that tuning cluster size is as simple as redirecting traffic to a different destination. We created a Kafka topic to generate the producing and consuming traffic for the test. For the sake of simplicity, we spread the traffic evenly across brokers. To achieve that, we created the testing topic with 10 times as many partitions as the number of brokers. Each broker is leader for exactly 10 partitions. Because writing to a partition is sequential, having too few partitions per broker can result in write contention, which limits the throughput. Based on our experiments, 10 is a good number to avoid letting write contention become throughput bottleneck.
Because of the distributed nature of our infrastructure, the clients are in different regions of the United States. Given that our test traffic is well below the limit of Dropbox’s network backbone, it should be safe to assume that limit found for cross region traffic also applies to local traffic.
What affects the workload?
There is a rich set of factors that can affect a Kafka cluster’s workload: number of producers, number of consumer groups, initial consumer offsets, message per second, size of each message, and the number of topics and partitions involved, to name a few. The degree of freedom for parameter setting is high. Therefore, it’s necessary for us to find the dominant factors, so that test complexity can be reduced to a practical level.
We explored different combinations of parameters that we considered relevant. Unsurprisingly, we concluded that the dominant factors to consider are the basic components of throughout: the number of messages per second (mps) produced and the byte size per message (bpm).
Traffic model
We took a formal approach to understanding Kafka’s limits. For a specific Kafka cluster, there is an associated traffic space. Each point in that multidimensional space corresponds to a unique traffic pattern that can be applied to Kafka, and it’s represented by a vector of parameters: < mps, bpm, # producers, # consumer groups, # topics, …>. All traffic patterns that don’t cause Kafka to overload form a closed subspace, and its surface will be the Kafka cluster’s limit.
For our initial test, we chose mps and bpm as the basis of the limit, so the traffic space is reduced to a 2D plane. The set of acceptable traffic forms a closed area. Finding Kafka limit is equivalent to plotting this area’s boundary.
Automate the testing
In order to plot the boundary with reasonable accuracy, we need to conduct hundreds of experiments with different settings, which is impractical to do manually. We therefore designed an algorithm to run all the experiments without human intervention.
Overload indicator
It’s critical to find a set of indicators which allows for programmatically judging Kafka’s healthiness. We explored a wide range of candidate indicators, and landed on a small set of the following indicators:
- IO thread idle below 20%: this means the pool of worker threads used by kafka for handling client requests are too busy to handle any more workload
- In-sync replica set changes over 50%: this means when traffic is applied, 50% of the time we observe at least one broker failing to keep up with replicating data from its leader
These metrics are also used by Jetstream to monitor Kafka health, and they are the first red flags raised when a cluster is under too much stress.
Finding the boundary
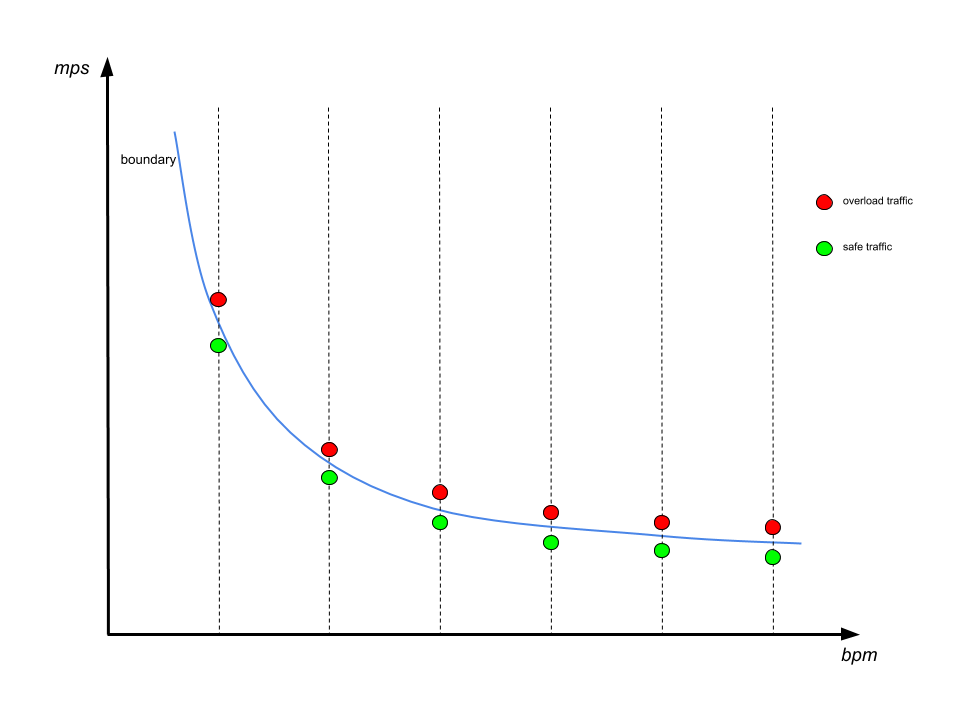
To find one boundary point, we fix the value in bpm dimension, and tried to push Kafka to overload by changing mps values. The boundary is found when we have an mps value that is safe, and another value close to it that causes overload. We then consider the safe value to be a boundary point. The boundary line is found by repeating this process for a range of bpm values, as is shown below:

It’s worth noting that instead of directly tuning mps, we tuned with different numbers of producers having the same produce rate, which is denoted with np. The main reason is that the produce rate of a single producer isn’t straightforward to control because of message batching. In contrast, changing the number of producers allows for linear scaling of the traffic. According to our early exploration, increasing the number of producers alone won’t cause a noticeable load difference to Kafka.
We start with finding a single boundary point with binary search. The search starts with a very large window of np [0, max], where max is a value that will definitely cause overload. In each iteration the middle value is chosen to generate traffic. If Kafka is overloaded at this value, then this middle value becomes the new upper bound, otherwise it becomes the new lower bound. The process stops when the window is narrow enough. We then consider the mps value corresponding to the current lower bound to be the boundary.
Result

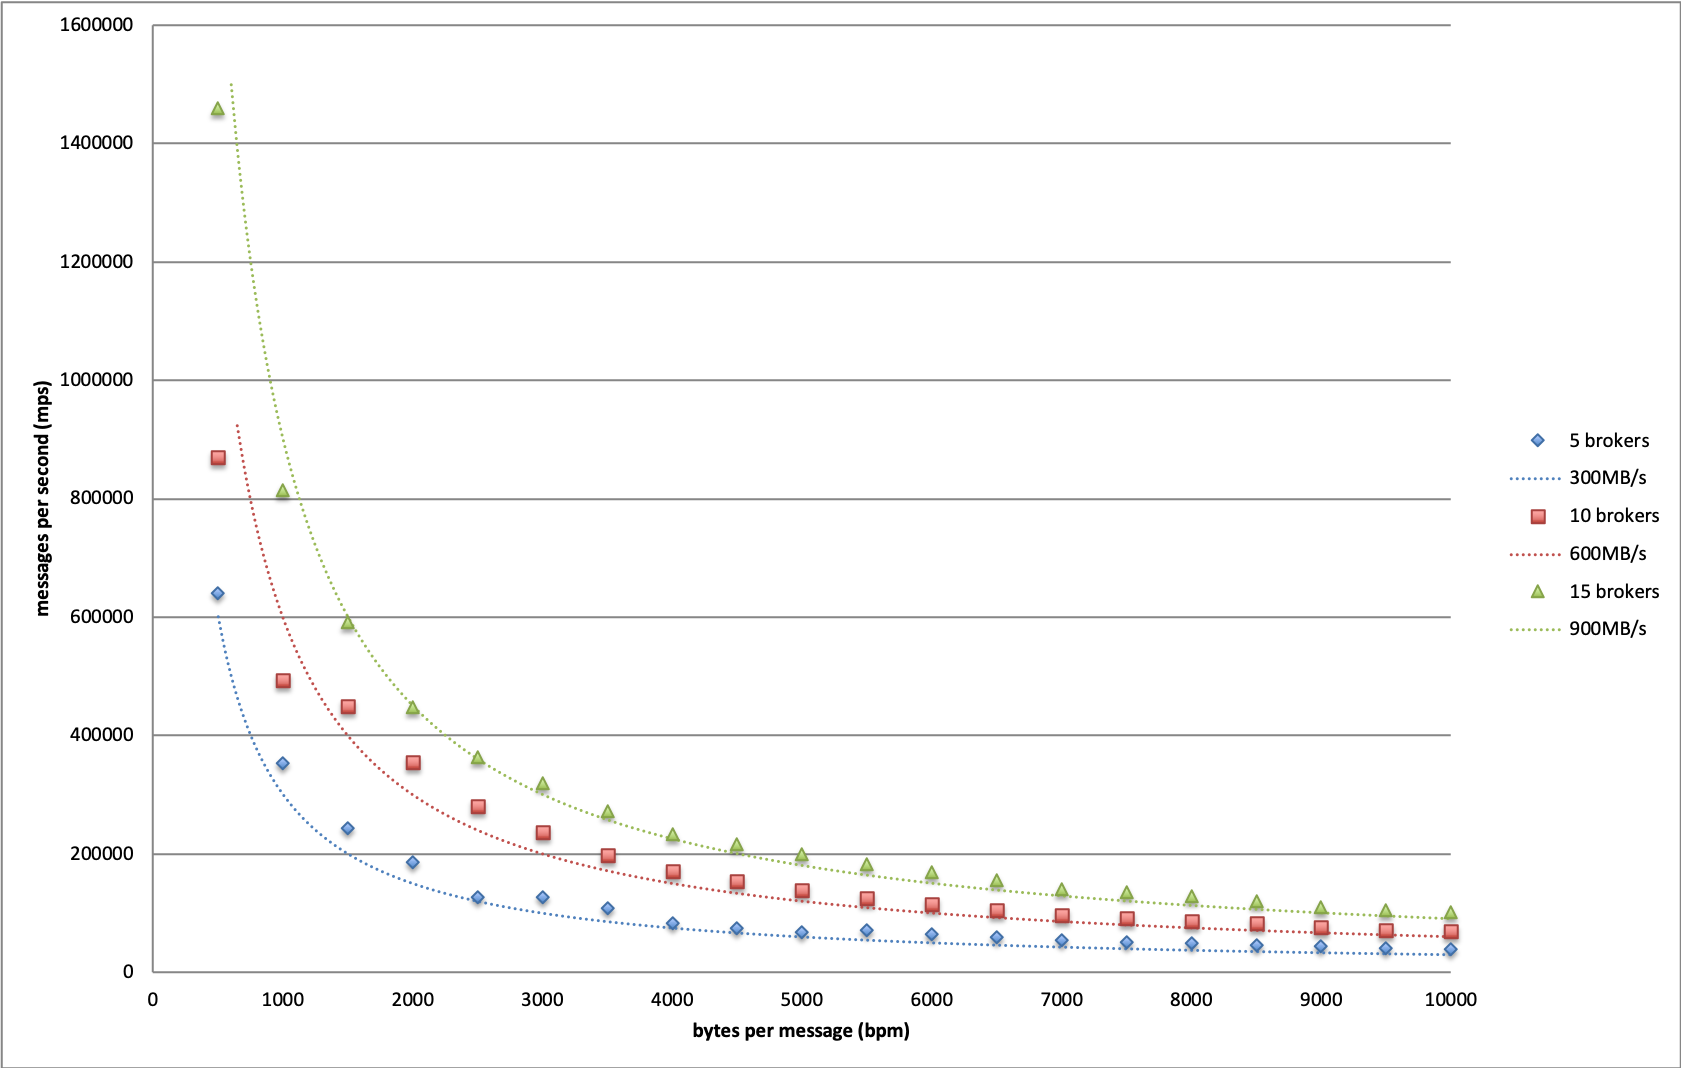
We plotted the boundaries for Kafka of different sizes in above graph. Based on this result, we conclude that the maximum throughput we can achieve in Dropbox infrastructure is 60MB/s per broker.
It is worth noting that this is a conservative limit, because the content of our test messages are fully randomized to minimize the effect of Kafka’s internal message compression. When traffic reaches its limit, both disk and network are extensively utilized. In production scenarios, Kafka messages usually conform to a certain pattern, as they are often constructed by similar procedures. This gives significant room for compression optimization. We tested an extreme case where messages consist of same character, and observed much higher throughput limits, as disk and network became much less of a bottleneck.
Additionally, this throughput limit holds when there are as many as 5 consumer groups subscribing to the testing topic. In another word, this write throughput is achievable when read throughput is 5 times as large. When the number of consumer groups increases beyond 5, write throughput starts to decline as the network becomes the bottleneck. Because the traffic ratio between read and write is much lower than 5 in Dropbox production use cases, the obtained limit is applicable to all production clusters.
This result provides guidelines for future Kafka provisioning. Suppose we want to allow up to 20% of all brokers to be offline, then the maximum safe throughput of a single broker should be 60MB/s * 0.8 ~= 50MB/s. With this we can determine cluster size based on estimated throughput of future use cases.
Leverage for Future work
The platform and automated tester will be a valuable asset to the Jetstream team down the road. When we switch to new hardware, change network configuration, or upgrade Kafka versions, we can simply rerun these tests and obtain the throughput limit in the new setting. We can apply the same methodology to explore other factors that may affect Kafka performance in different ways. Finally, the platform can serve as test bench for Jetstream to simulate new traffic patterns or reproduce issues in an isolated environment.
Wrap up
In this post we presented our systematic approach to understanding Kafka’s limits. It is important to note that we obtained these results in Dropbox infrastructure, so our numbers may not apply to other Kafka instances due to different hardware, software stack, and network conditions. We hope the technique presented here can be useful for readers to understand their own systems.
Many thanks to members of Jetstream: John Watson, Kelsey Fix, Rajiv Desai, Richi Gupta, Steven Rodrigues, and Varun Loiwal. Additionally, special thanks to Renjish Abraham for helping review the results. Jetstream is always looking for engineers who are passionate about large scale data processing using open source technologies. If you are interested in joining, please check out the open positions at Dropbox and reach out to us!

